Flu season in Iceland
Current flu, COVID-19 and RSV activity in Iceland — based on ECDC ERVISS weekly data from the Directorate of Health (Landlæknir). Rescaled into a consultation-equivalent signal for a qualitative low / moderate / high classification.
Current situation: Influenza
In week 15 of 2026, activity of influenza (seasonal flu) in Iceland is low. The trend — derived from clinical surveillance — is falling. Over a four-week comparison, a clear decline is visible.
The classification is based on the ECDC ERVISS weekly reports, drawing on data from the Directorate of Health (Landlæknir) via primary-care surveillance and Landspítali laboratory data. Seasonally, infection waves in Iceland typically peak between January and March; activity is usually markedly lower during the summer months. How severe a given season becomes depends on the circulating virus variant and the population's immune status, among other factors.
Data sources and methodology
The current picture for Iceland is built on the European Respiratory Virus Surveillance Summary (ERVISS), published weekly by the European Centre for Disease Prevention and Control (ECDC). the Directorate of Health (Landlæknir) via primary-care surveillance and Landspítali laboratory data is the national public-health authority that feeds ERVISS with sentinel primary care and virology data.
ECDC ERVISS
ERVISS is ECDC's weekly pan-European surveillance summary for influenza, SARS-CoV-2 and RSV. National authorities — in Iceland's case the Directorate of Health (Landlæknir) via primary-care surveillance and Landspítali laboratory data — submit harmonised indicators every week, which ECDC publishes in a standardised dataset on Thursdays. Using ERVISS rather than each country's native portal ensures cross-country comparability.
ILI / ARI consultation rates and positivity
the Directorate of Health (Landlæknir) via primary-care surveillance and Landspítali laboratory data operates a sentinel network of general practices that report weekly rates of patients consulting for influenza-like illness (ILI) or acute respiratory infection (ARI). A subset of patients is swabbed and tested by reference laboratories, producing pathogen-specific positivity rates for flu, SARS-CoV-2 and RSV.
Why this source
Combining consultation incidence with virological positivity yields a pathogen-specific weekly incidence signal (ILI × positivity / 100). This is the standard European methodology and provides a more robust view than either indicator alone — consultation rates capture illness burden, positivity confirms which pathogen is driving it.
Qualitative classification
The “low”, “moderate” and “high” categories follow seasonal reference values and epidemiological thresholds calibrated to match our classifications for other countries. The ILI × positivity / 100 product is scaled to comparable thresholds using a divisor of 3, which aligns European sentinel peaks with the consultation-equivalent scale used elsewhere. Data refreshes weekly when ECDC publishes the latest ERVISS update, typically on Thursdays.
Frequently asked questions
When is flu season in Iceland?
Icelandic flu activity typically begins rising in late December, peaks between January and March, and fades into April. Iceland's small population means the season can be dominated by a single introduction or subtype, so individual weeks sometimes look noisier than in larger countries. The Directorate of Health (Embætti landlæknis) publishes weekly updates drawing on primary-care surveillance and laboratory data from Landspítali, the national university hospital in Reykjavík.
How does Landlæknir classify flu severity?
Landlæknir describes influenza activity in qualitative bands — low, moderate, high — based on primary-care consultations for influenza-like illness and laboratory positivity at Landspítali. These classifications appear in the weekly respiratory-virus bulletin and are reported to ECDC for the European Respiratory Virus Surveillance Summary (ERVISS). Because Iceland is small, multi-week trends are more reliable than any single week — individual data points carry more statistical noise than in larger countries.
How is flu surveillance organised in Iceland?
Iceland's influenza surveillance combines primary-care reporting from health centres, laboratory testing at Landspítali (University Hospital) which acts as the national reference centre, and hospital notifications of severe cases. Weekly bulletins integrate these indicators and feed ECDC ERVISS, which places Iceland's trajectory alongside the other Nordic countries. The small population makes cross-country comparison an important context for interpreting trends.
Is the flu vaccine free in Iceland?
Iceland offers subsidised or free seasonal influenza vaccination to priority groups defined by Landlæknir, including adults aged 60 and above, pregnant women, people with chronic illnesses, residents of long-term-care facilities, and healthcare workers. Vaccines are delivered through health centres and primary-care practices. Landlæknir reports vaccine-uptake estimates alongside the weekly surveillance bulletin.
How does Iceland compare to its Nordic and Atlantic neighbours?
Because Iceland reports into ECDC ERVISS with harmonised indicators, its weekly flu classification is directly comparable with Norway, Denmark, Ireland, and the UK. Iceland's Atlantic climate and Nordic health-service structure mean its peak windows often resemble those of other Nordic countries, though the small population amplifies random week-to-week variation. Reading multi-week trends rather than isolated points is the most reliable approach.
Want the actual numbers?
You'll find them in the app.
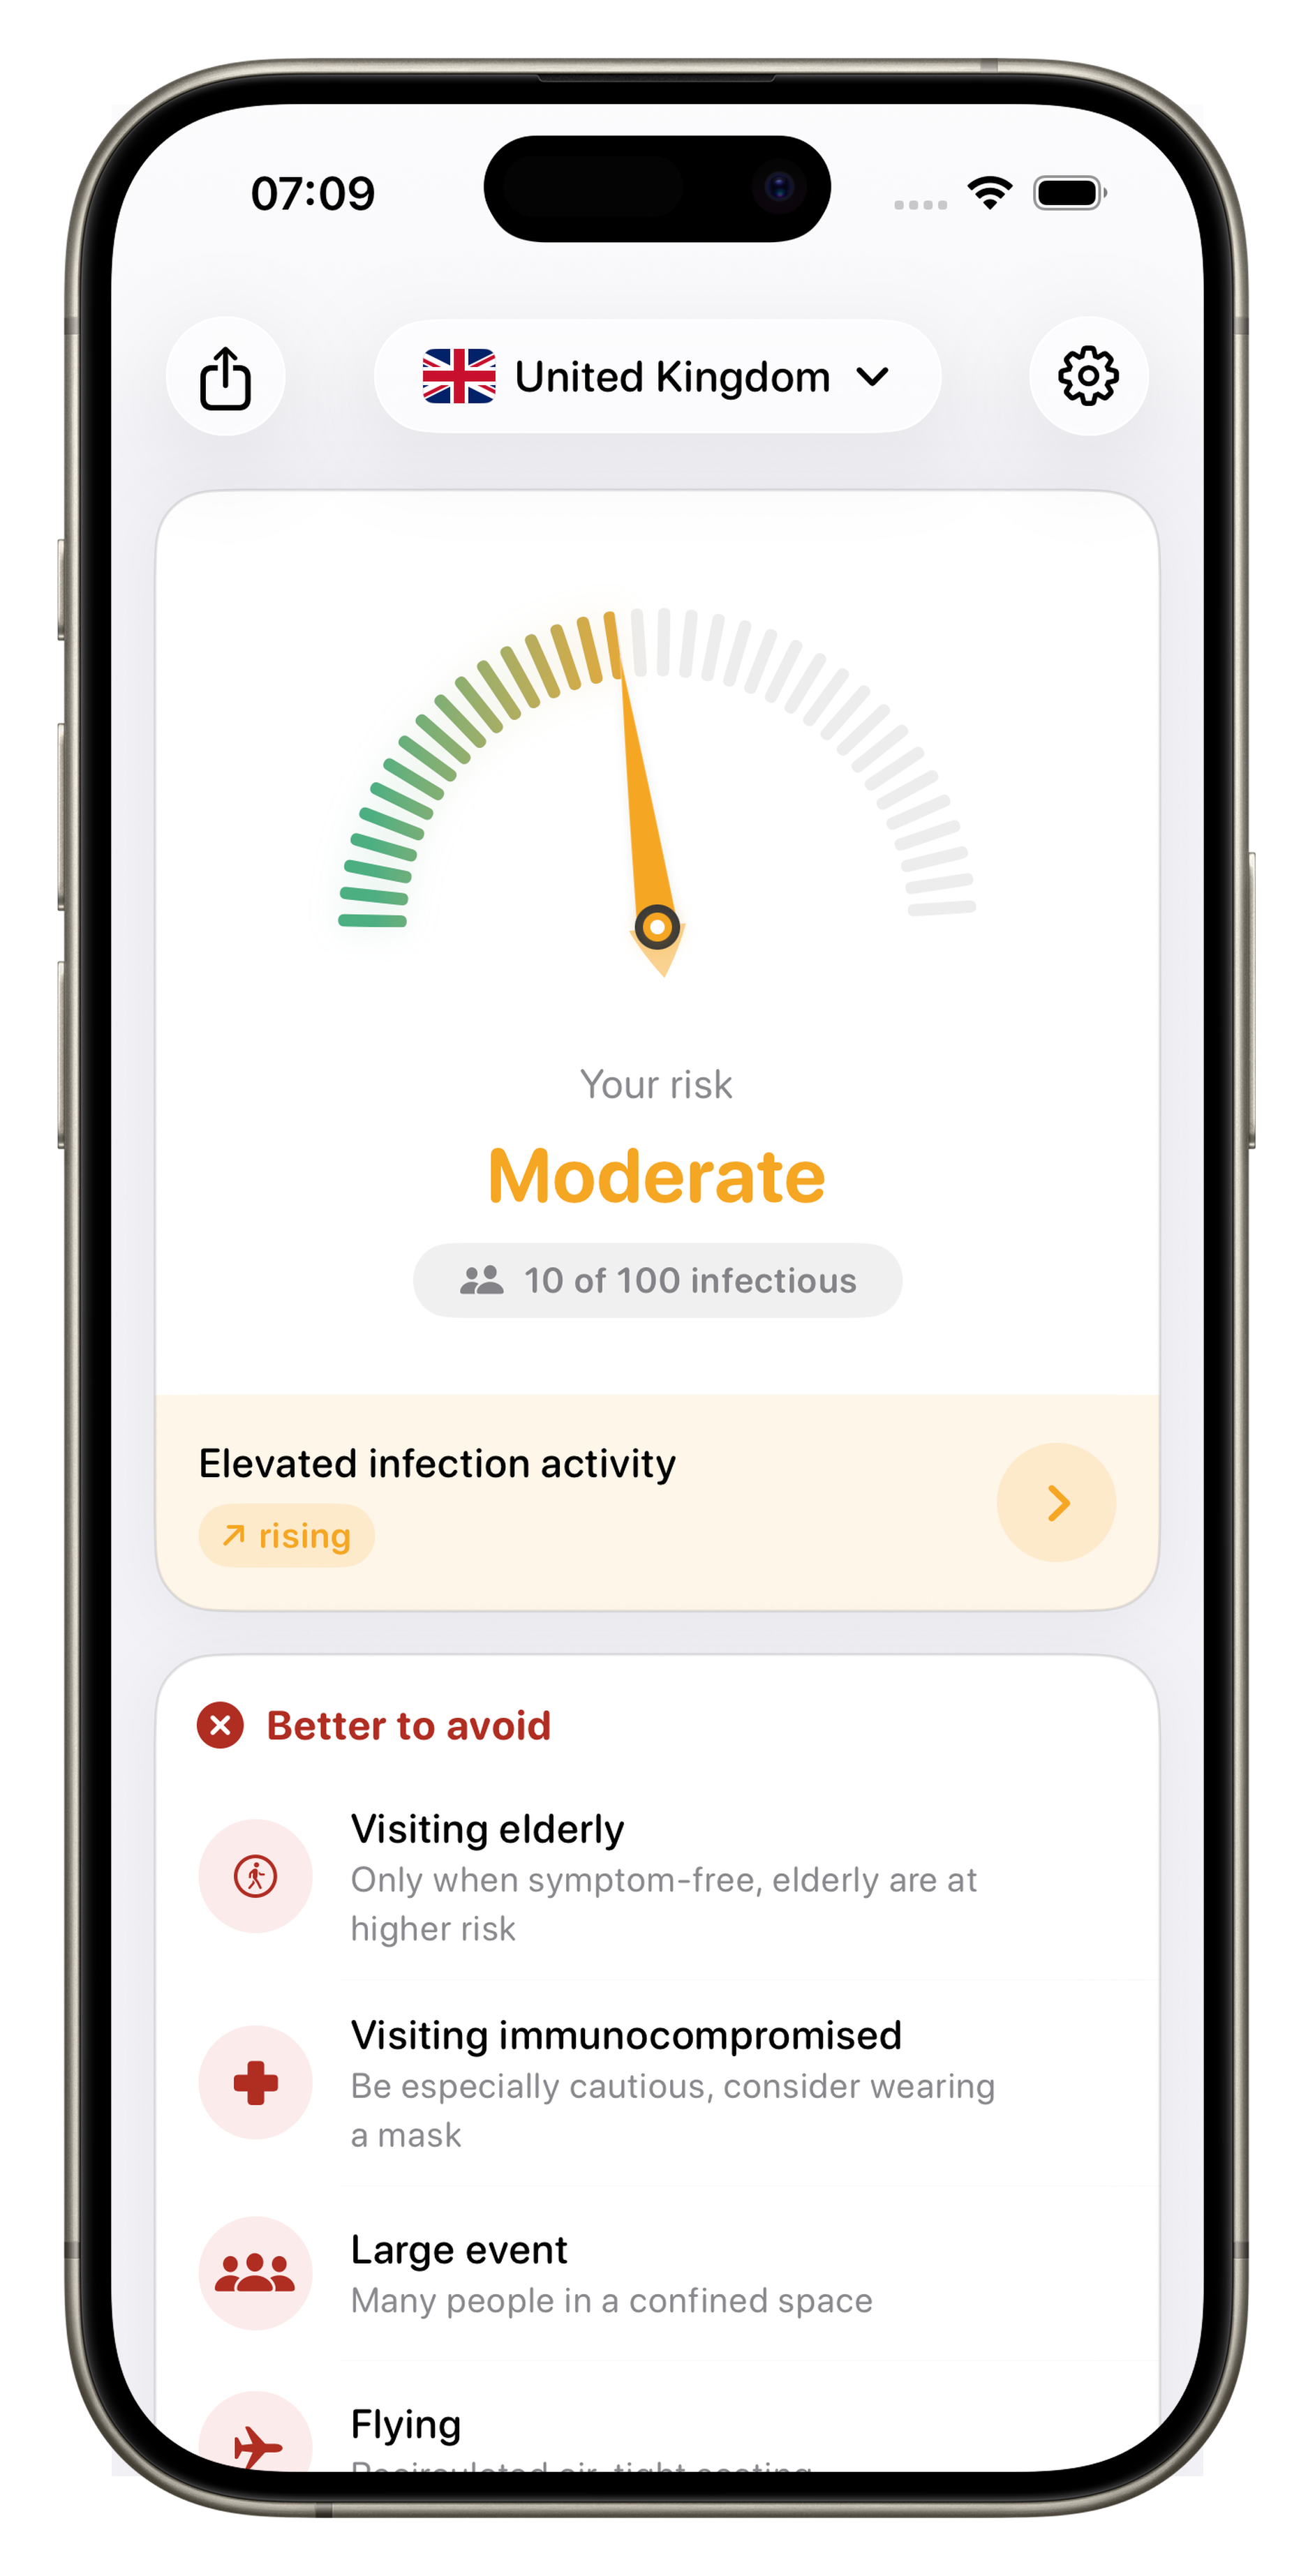
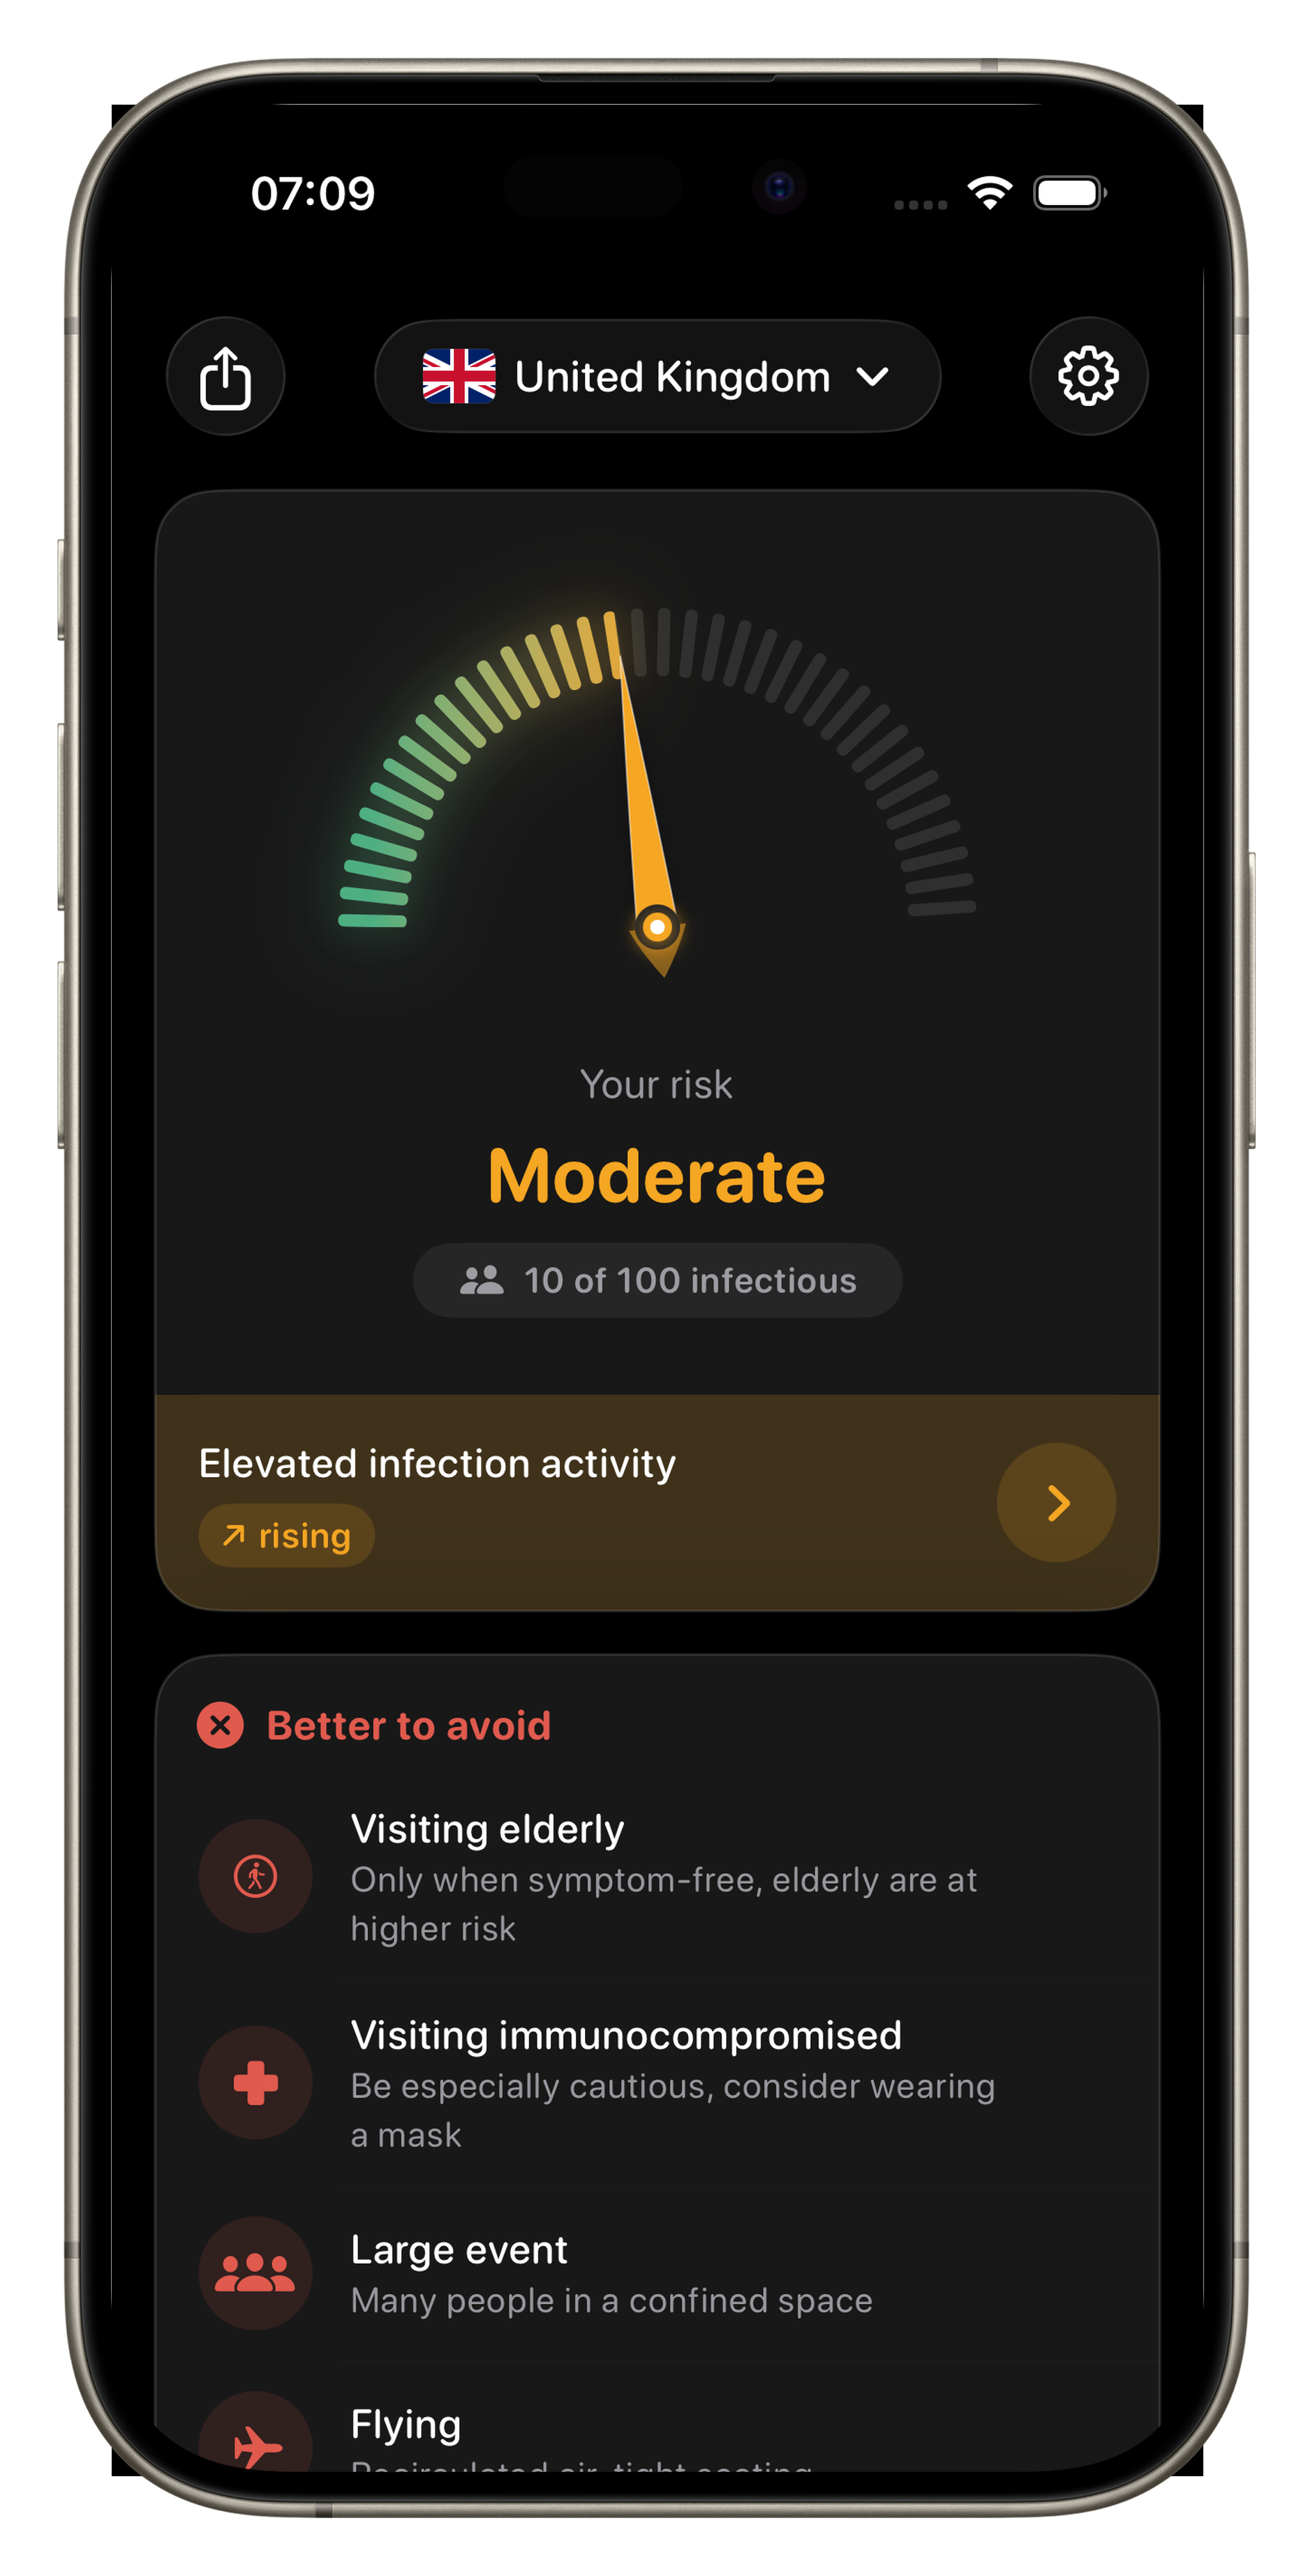
Here you only see the trend. In the app: exact incidence rates, “X out of 100 people infectious”, your personal risk based on age and pre-existing conditions, wastewater trends, 36 countries, home-screen widget.