Respiratory illness in Japan
The three major respiratory pathogens side by side — influenza, COVID-19 and RSV — based on WHO FluNet weekly aggregate of NIID sentinel laboratory data.
Current situation: Influenza
In week 14 of 2026, activity of influenza (seasonal flu) in Japan is low. The trend — derived from clinical surveillance — is falling. Over a four-week comparison, a clear decline is visible.
The classification is based on the WHO FluNet aggregate of sentinel laboratory data from Japan's National Institute of Infectious Diseases (NIID). Seasonally, infection waves in Japan typically peak between January and February; activity is usually markedly lower during the summer months. How severe a given season becomes depends on the circulating virus variant and the population's immune status, among other factors.
Current situation: RSV
In week 14 of 2026, activity of respiratory syncytial virus (RSV) in Japan is low. The trend — derived from clinical surveillance — is stable. Activity has barely shifted over the past few weeks.
The classification is based on the WHO FluNet aggregate of sentinel laboratory data from Japan's National Institute of Infectious Diseases (NIID), which includes RSV positivity indicators. Seasonally, infection waves in Japan typically peak between December and February; activity is usually markedly lower in spring and summer. How severe a given season becomes depends on the circulating virus variant and the population's immune status, among other factors.
Data sources and methodology
The current picture for Japan is built on WHO FluNet, the World Health Organization's global platform for influenza surveillance. the National Institute of Infectious Diseases (NIID) reports weekly sentinel laboratory results to FluNet, which we translate into a consultation-equivalent signal.
WHO FluNet
FluNet is the WHO's weekly global influenza surveillance database. National influenza centres and reference laboratories — for Japan this is the National Institute of Infectious Diseases (NIID) — submit the number of respiratory specimens tested and the number positive for influenza and, where available, RSV. Using FluNet ensures a consistent, internationally comparable data source for countries without a European-style sentinel consultation system.
Positivity-based signal
Unlike ECDC ERVISS, FluNet does not carry outpatient consultation rates. Our headline signal is therefore derived from the weekly lab positivity rate (percent of tested specimens that are positive), multiplied by a pathogen-specific scaling factor — 80 for influenza and 50 for RSV — to approximate a consultation-equivalent incidence. COVID-19 is not available via FluNet and is therefore not shown for these countries.
Why this source
FluNet is the only weekly, comparable dataset covering many non-European countries. Positivity is relatively insensitive to changes in overall testing volume, which makes it a reasonable proxy for underlying transmission pressure even when the denominator fluctuates. We apply a SENTINEL-only filter where appropriate to reduce noise from non-sentinel reporting streams.
Qualitative classification
The “low”, “moderate” and “high” categories follow seasonal reference values and epidemiological thresholds calibrated to match our classifications for other countries. The positivity × scaling-factor product is mapped to the same consultation-equivalent scale we use elsewhere so results stay comparable across regions. Data refreshes weekly when WHO publishes the latest FluNet update.
Frequently asked questions
How is overall respiratory-illness activity tracked in Japan?
NIID aggregates weekly reports from its national sentinel networks for influenza and RSV, together with virological testing at prefectural laboratories. Published in the Infectious Agents Surveillance Report (IASR), these indicators describe the burden carried by primary care and paediatric services. The same data is transmitted to WHO FluNet for international comparison.
Why isn't COVID-19 tracked here alongside flu and RSV?
WHO FluNet — the international platform that aggregates Japan's sentinel data — covers influenza and RSV, not SARS-CoV-2. COVID-19 has its own surveillance streams, including genomic and wastewater systems. That is why data pages built on FluNet for Japan, India, and China focus on flu and RSV only. COVID-19 monitoring in Japan continues via other NIID and Ministry of Health channels.
Why does respiratory illness peak in Japanese winters?
Japan's winter respiratory peak reflects the usual mix of cold, dry indoor air, reduced ventilation, and dense indoor contact in workplaces and schools. Influenza drives the sharp January–February spike, while RSV may contribute either earlier or during winter depending on the year. The combined curve is one of the most sharply defined in the Northern Hemisphere.
How does Japan compare internationally?
Japan's flu peak typically arrives earlier and is more tightly concentrated in January–February than European or US peaks. RSV timing has been less stable since 2021. Because NIID feeds WHO FluNet, Japan's trajectory can be overlaid directly with other Western Pacific countries — South Korea, Australia, China — and with Northern-Hemisphere countries elsewhere.
How does NIID classify respiratory-illness activity?
NIID uses qualitative tiers — baseline, caution, warning, epidemic — for influenza, with separate activity classifications for RSV anchored to historical reference ranges. These tiers describe whether current sentinel reporting rates are ordinary, elevated, or unusually intense. They intentionally avoid implying precision that sentinel-based surveillance cannot support.
Want the actual numbers?
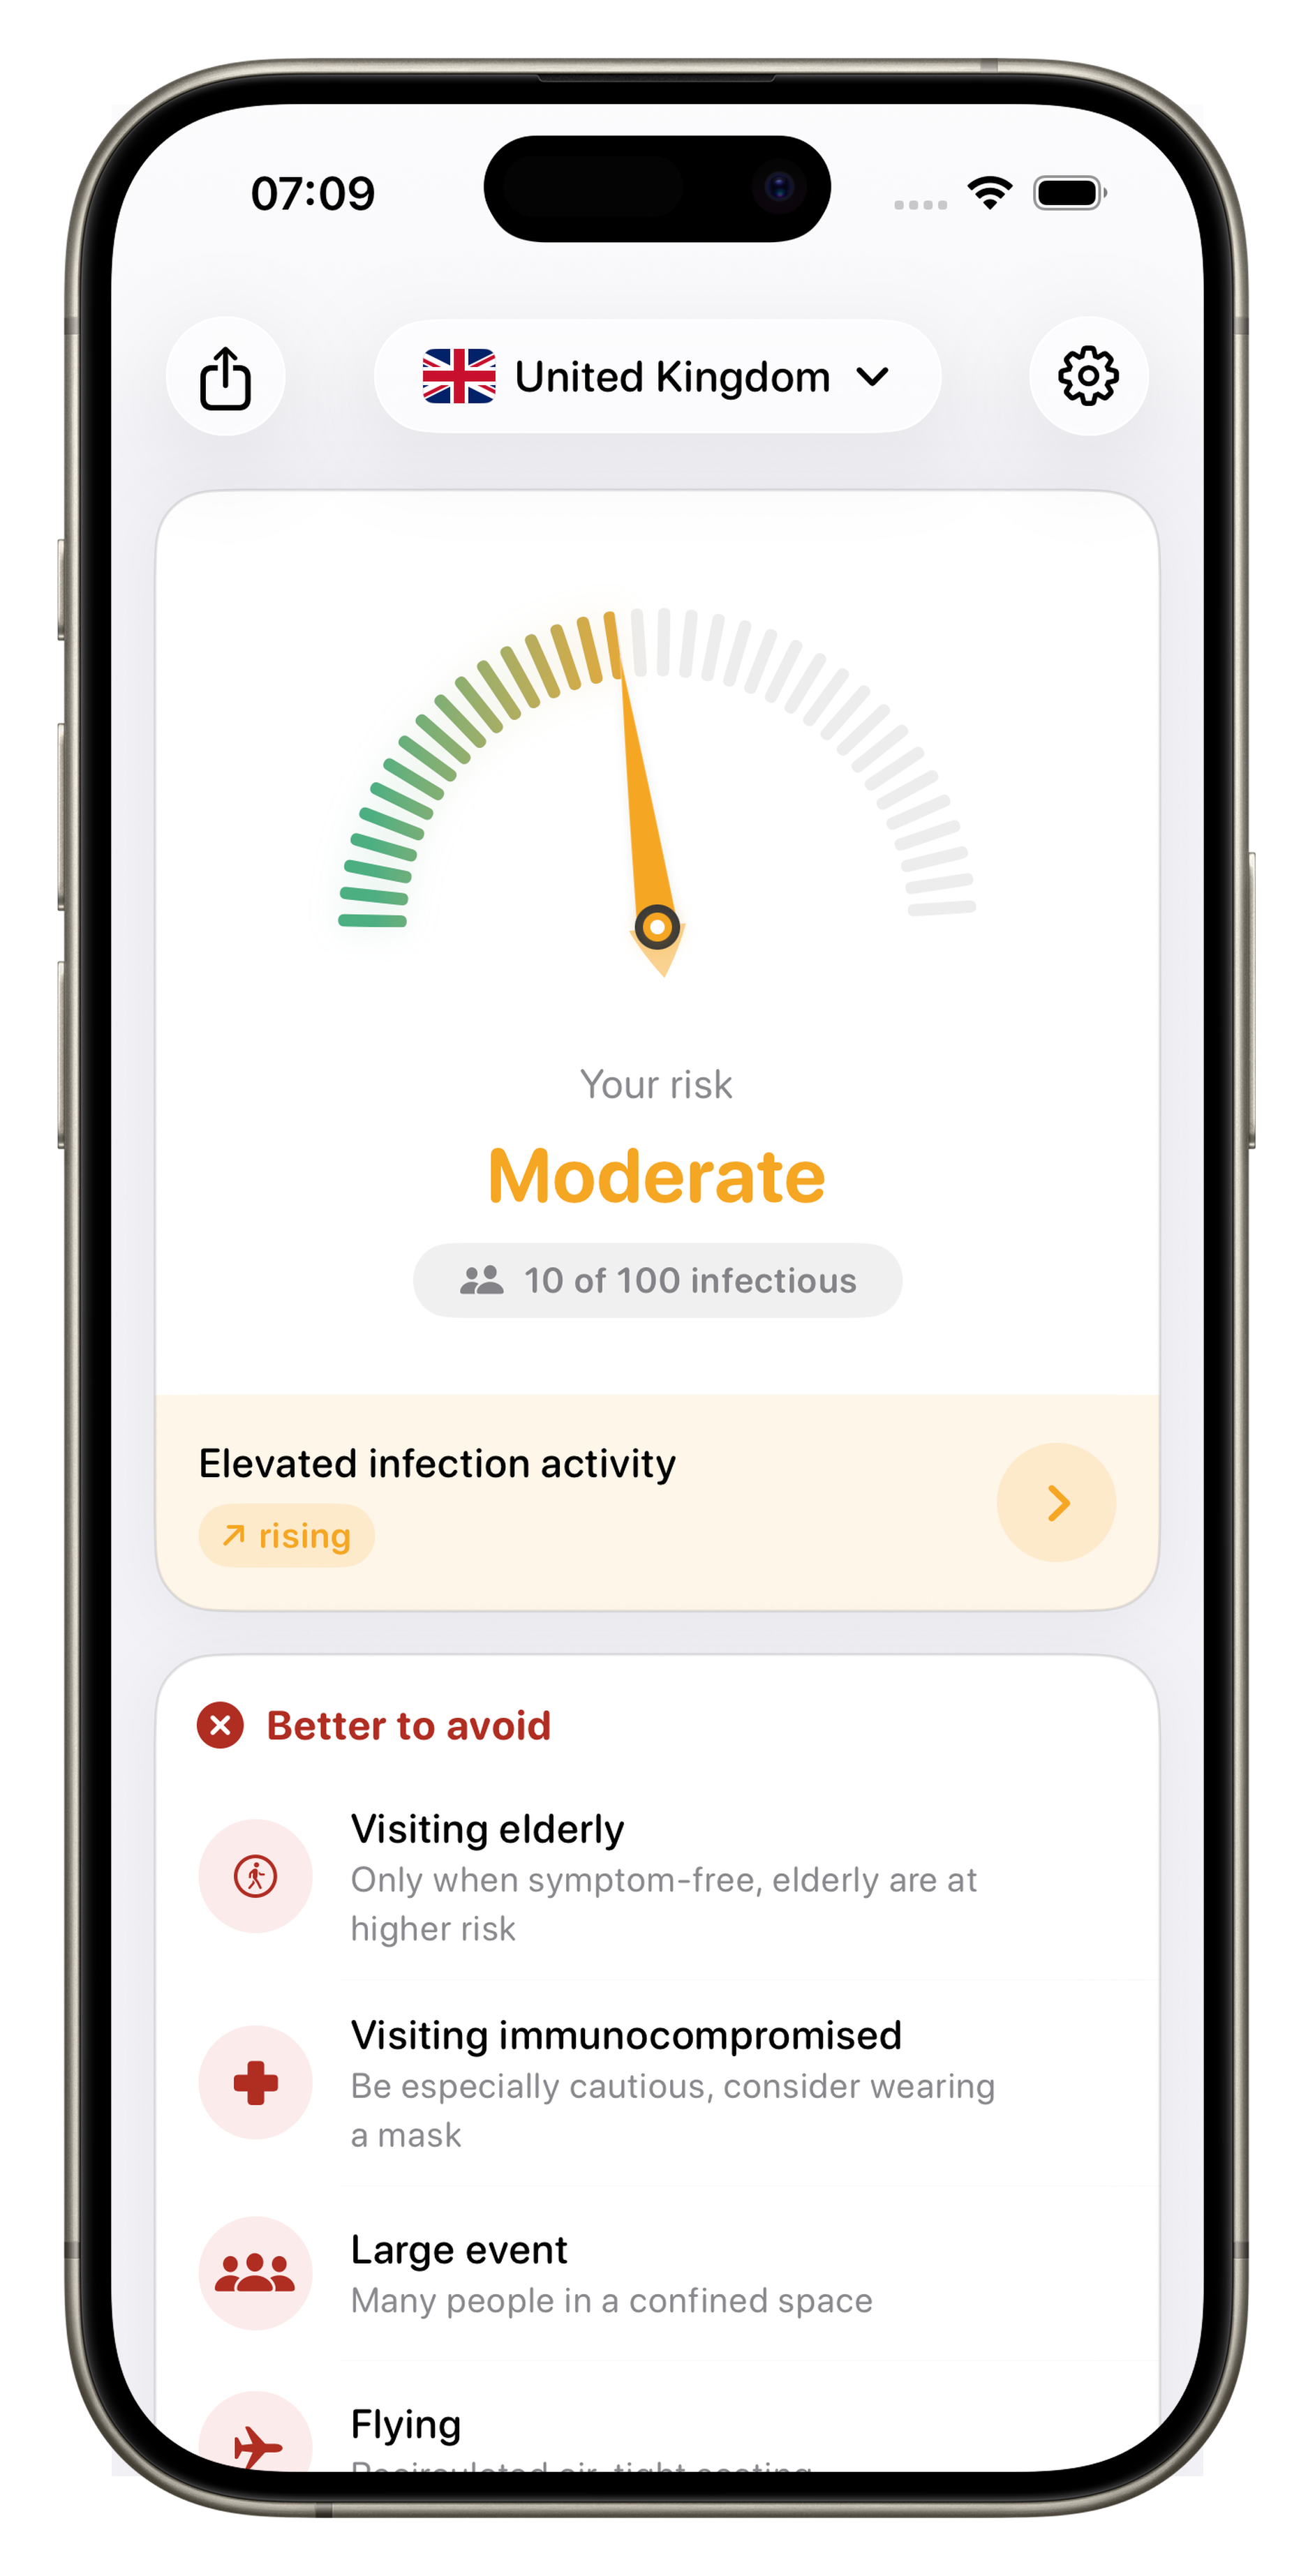
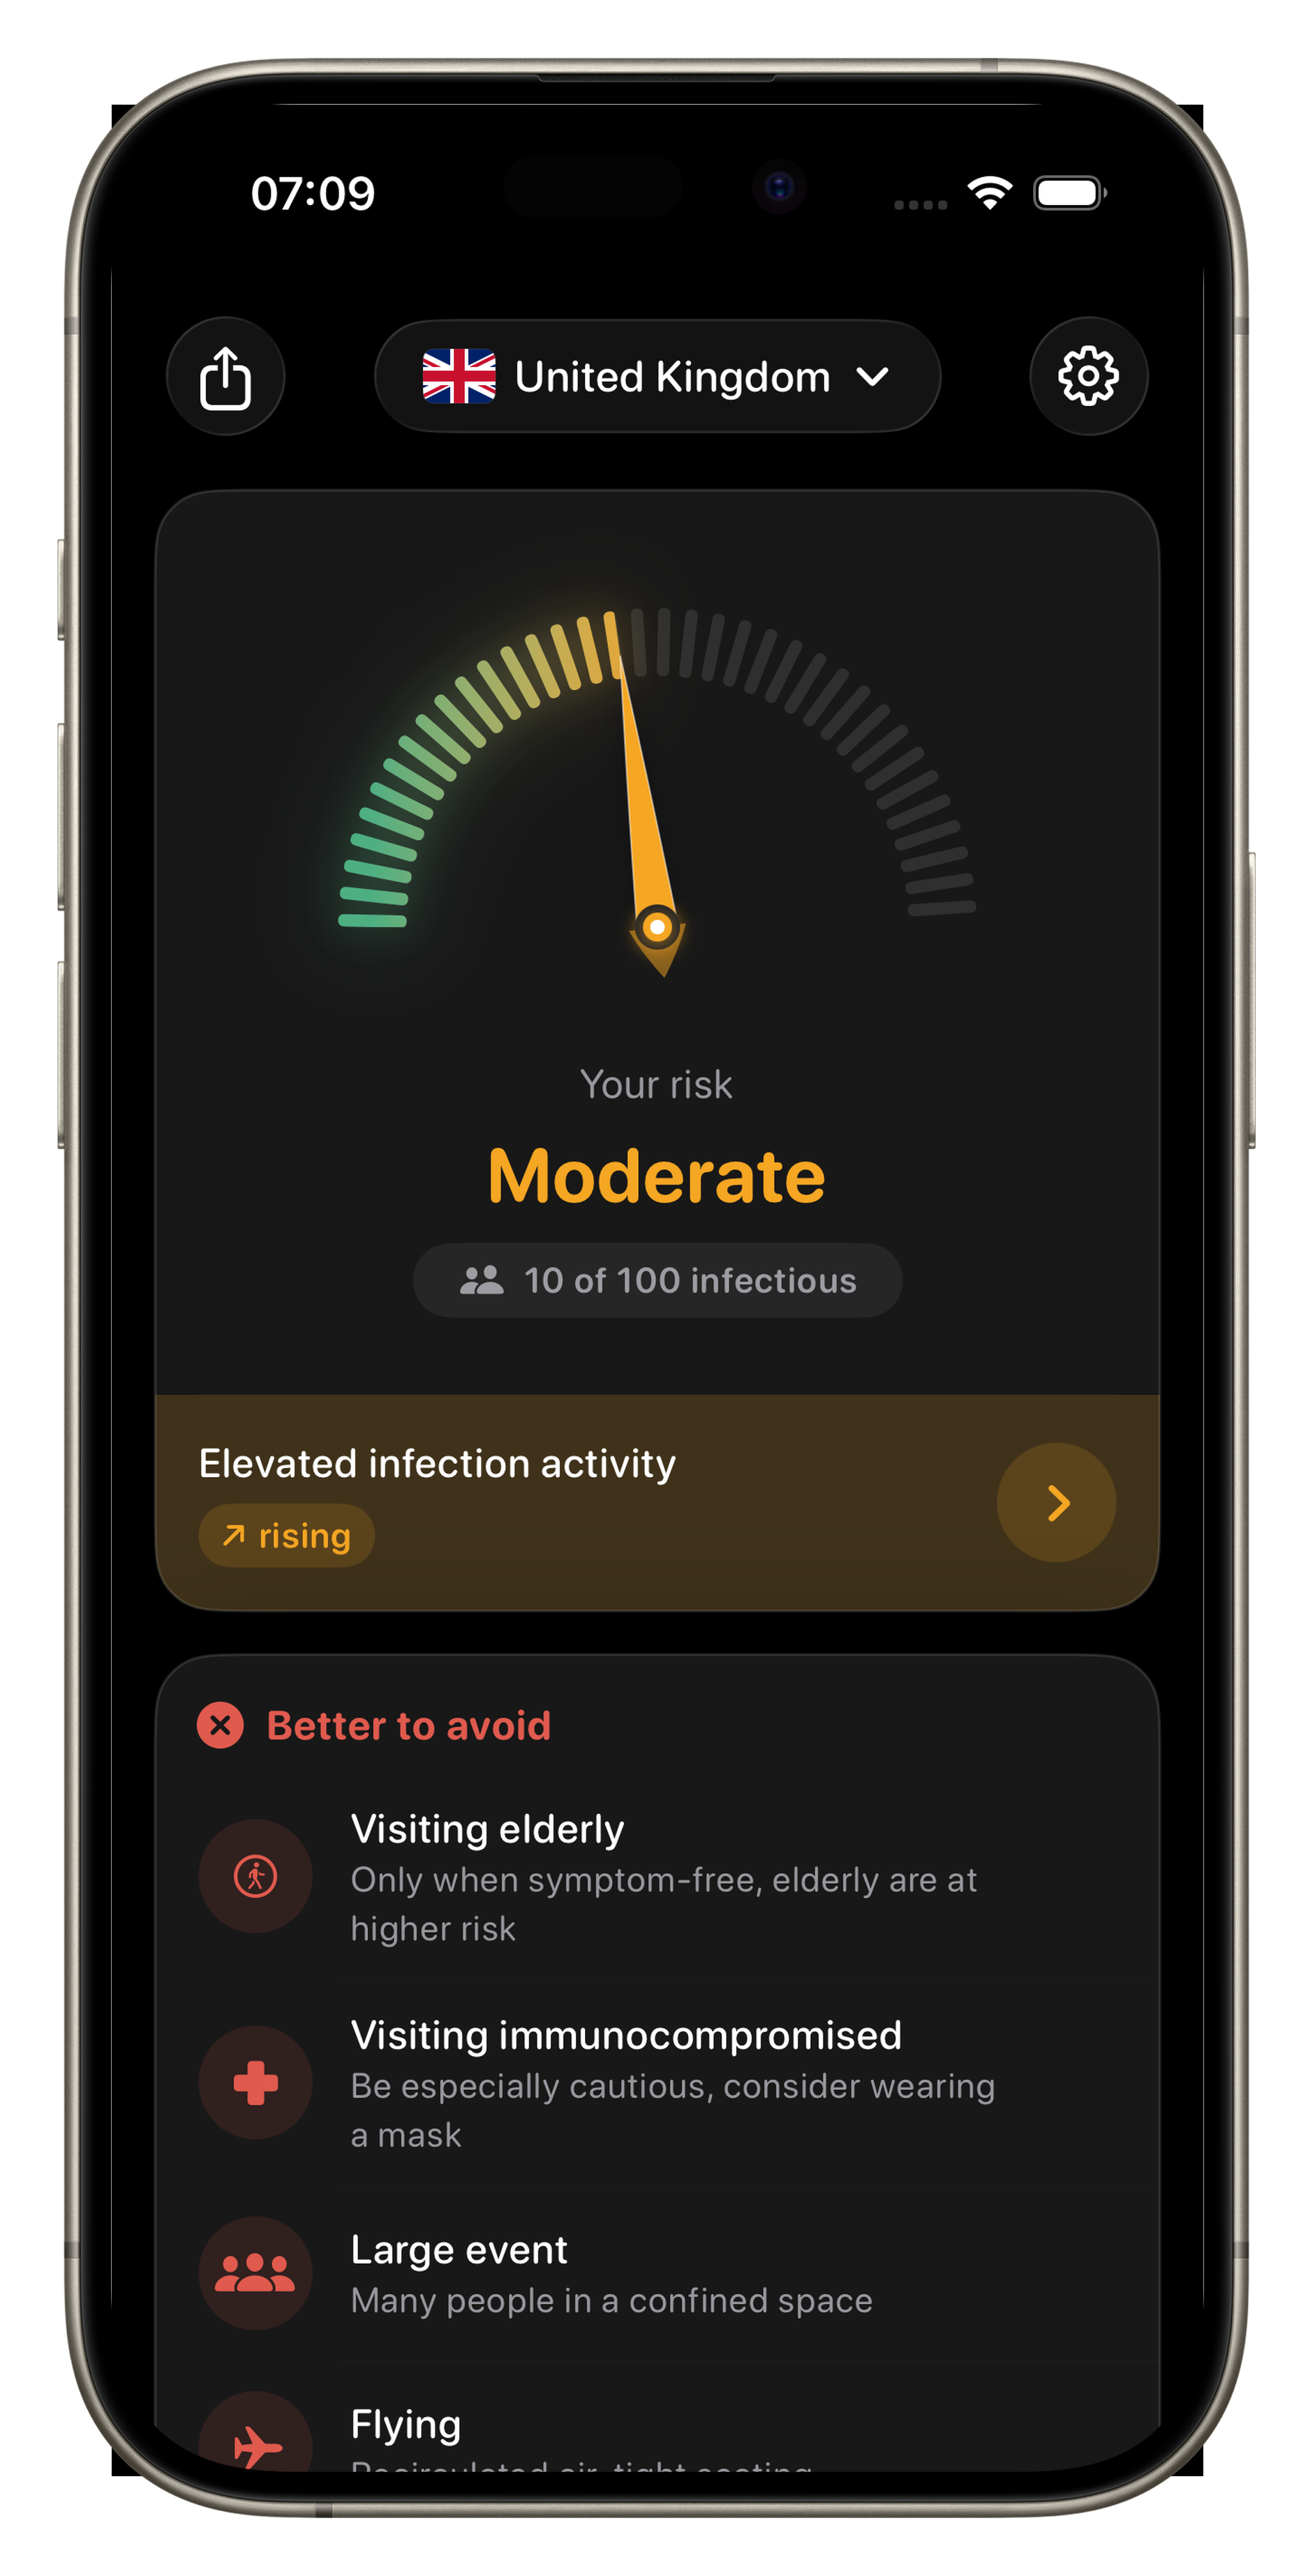
You'll find them in the app.
Here you only see the trend. In the app: exact incidence rates, “X out of 100 people infectious”, your personal risk based on age and pre-existing conditions, wastewater trends, 36 countries, home-screen widget.