COVID-19 in the United States
Current COVID-19 activity in the US — based on CDC NHSN weekly confirmed hospital admissions per 100,000. Set against the parallel flu and RSV trajectories.
Current situation: COVID-19
In week 15 of 2026, activity of COVID-19 in the United States is low. The trend — derived from weekly hospital admission rates — is falling. Over a four-week comparison, a clear decline is visible.
The classification is based on CDC NHSN weekly confirmed COVID-19 hospital admissions per 100,000 population. Seasonally, infection waves in the United States typically peak during winter, with frequent summer waves driven by new variants; activity is usually markedly lower in late spring between waves. How severe a given season becomes depends on the circulating virus variant and the population's immune status, among other factors.
Data sources and methodology
The current picture for the United States is built on the CDC's National Healthcare Safety Network (NHSN) weekly hospital admissions data. NHSN collects laboratory-confirmed admission rates per 100,000 population for influenza, COVID-19 and RSV, submitted by participating hospitals nationwide. We rescale these hospitalization rates into a consultation-equivalent signal so the qualitative “low / moderate / high” categories are consistent with how we report other countries.
CDC NHSN (Hospital Respiratory Data)
NHSN is the CDC's national surveillance system for healthcare-associated infections. Since 2022, hospitals report weekly counts of confirmed influenza, COVID-19 and RSV admissions. We use the jurisdiction-level USA rates (admissions per 100,000 population per week), which give an unbiased picture of severe illness pressure on the healthcare system.
CDC FluView
CDC FluView is the long-running weekly flu surveillance report, drawing on outpatient ILI visits via the ILINet sentinel network, public health laboratory results, and hospitalization data. While our headline level is driven by NHSN, FluView provides the context for how a season compares to the typical seasonal curve.
Why hospitalization rates
Unlike clinic visits or self-reports, hospital admissions remain reliable across changes in testing behaviour and reporting practices. They reflect severe outcomes — the load that matters most for health-system capacity — and are reported with a roughly one-week lag.
Qualitative classification
The “low”, “moderate” and “high” categories follow seasonal reference values and epidemiological thresholds calibrated to match our classifications for other countries. Hospitalization rates are scaled to consultation-equivalent incidence using pathogen-specific conversion factors derived from typical seasonal peaks in both systems. Data refreshes weekly when the CDC publishes the latest NHSN update, typically late in the week.
Frequently asked questions
How is COVID-19 tracked in the United States?
The CDC tracks COVID-19 primarily through its COVID Data Tracker and the NHSN network of hospitals. Weekly hospital admission rates, emergency department visits, wastewater surveillance, and variant sampling combine to give a picture of current activity. Since population-wide testing has wound down, hospital and wastewater signals have become the most reliable indicators of transmission.
Is COVID-19 still a serious illness?
For most people, especially those who are vaccinated or have had prior infections, current COVID-19 variants tend to cause illness similar to a bad cold or moderate flu. However, the virus continues to cause significant hospitalizations and deaths, particularly among older adults, the immunocompromised, and those with underlying conditions. Long COVID remains a concern across age groups, though the risk appears lower with vaccination and in those with milder initial infections.
Do I need a COVID-19 booster?
The CDC currently recommends that everyone 6 months and older stay up to date with the latest COVID-19 vaccine, with specific additional doses recommended for adults 65 and older and immunocompromised individuals. Boosters reduce the risk of severe illness, hospitalization, and long COVID. Timing matters: aim to get boosted before the winter respiratory season if possible.
When do COVID-19 waves typically occur?
Unlike influenza, COVID-19 has not settled into a clear single seasonal pattern. The US has consistently seen a winter wave (December–February), but summer waves have also occurred regularly, often driven by new variants that partially escape existing immunity. Activity can rise quickly once a new variant takes hold, so tracking wastewater and hospitalization trends remains useful year-round.
What does wastewater surveillance tell us?
Wastewater surveillance measures how much SARS-CoV-2 genetic material is being shed in sewage. Because infected people shed virus before they get tested or seek care, the signal can indicate rising community transmission days to weeks ahead of clinical case counts. The CDC and state health departments publish wastewater dashboards that are particularly useful now that home testing makes case counts unreliable.
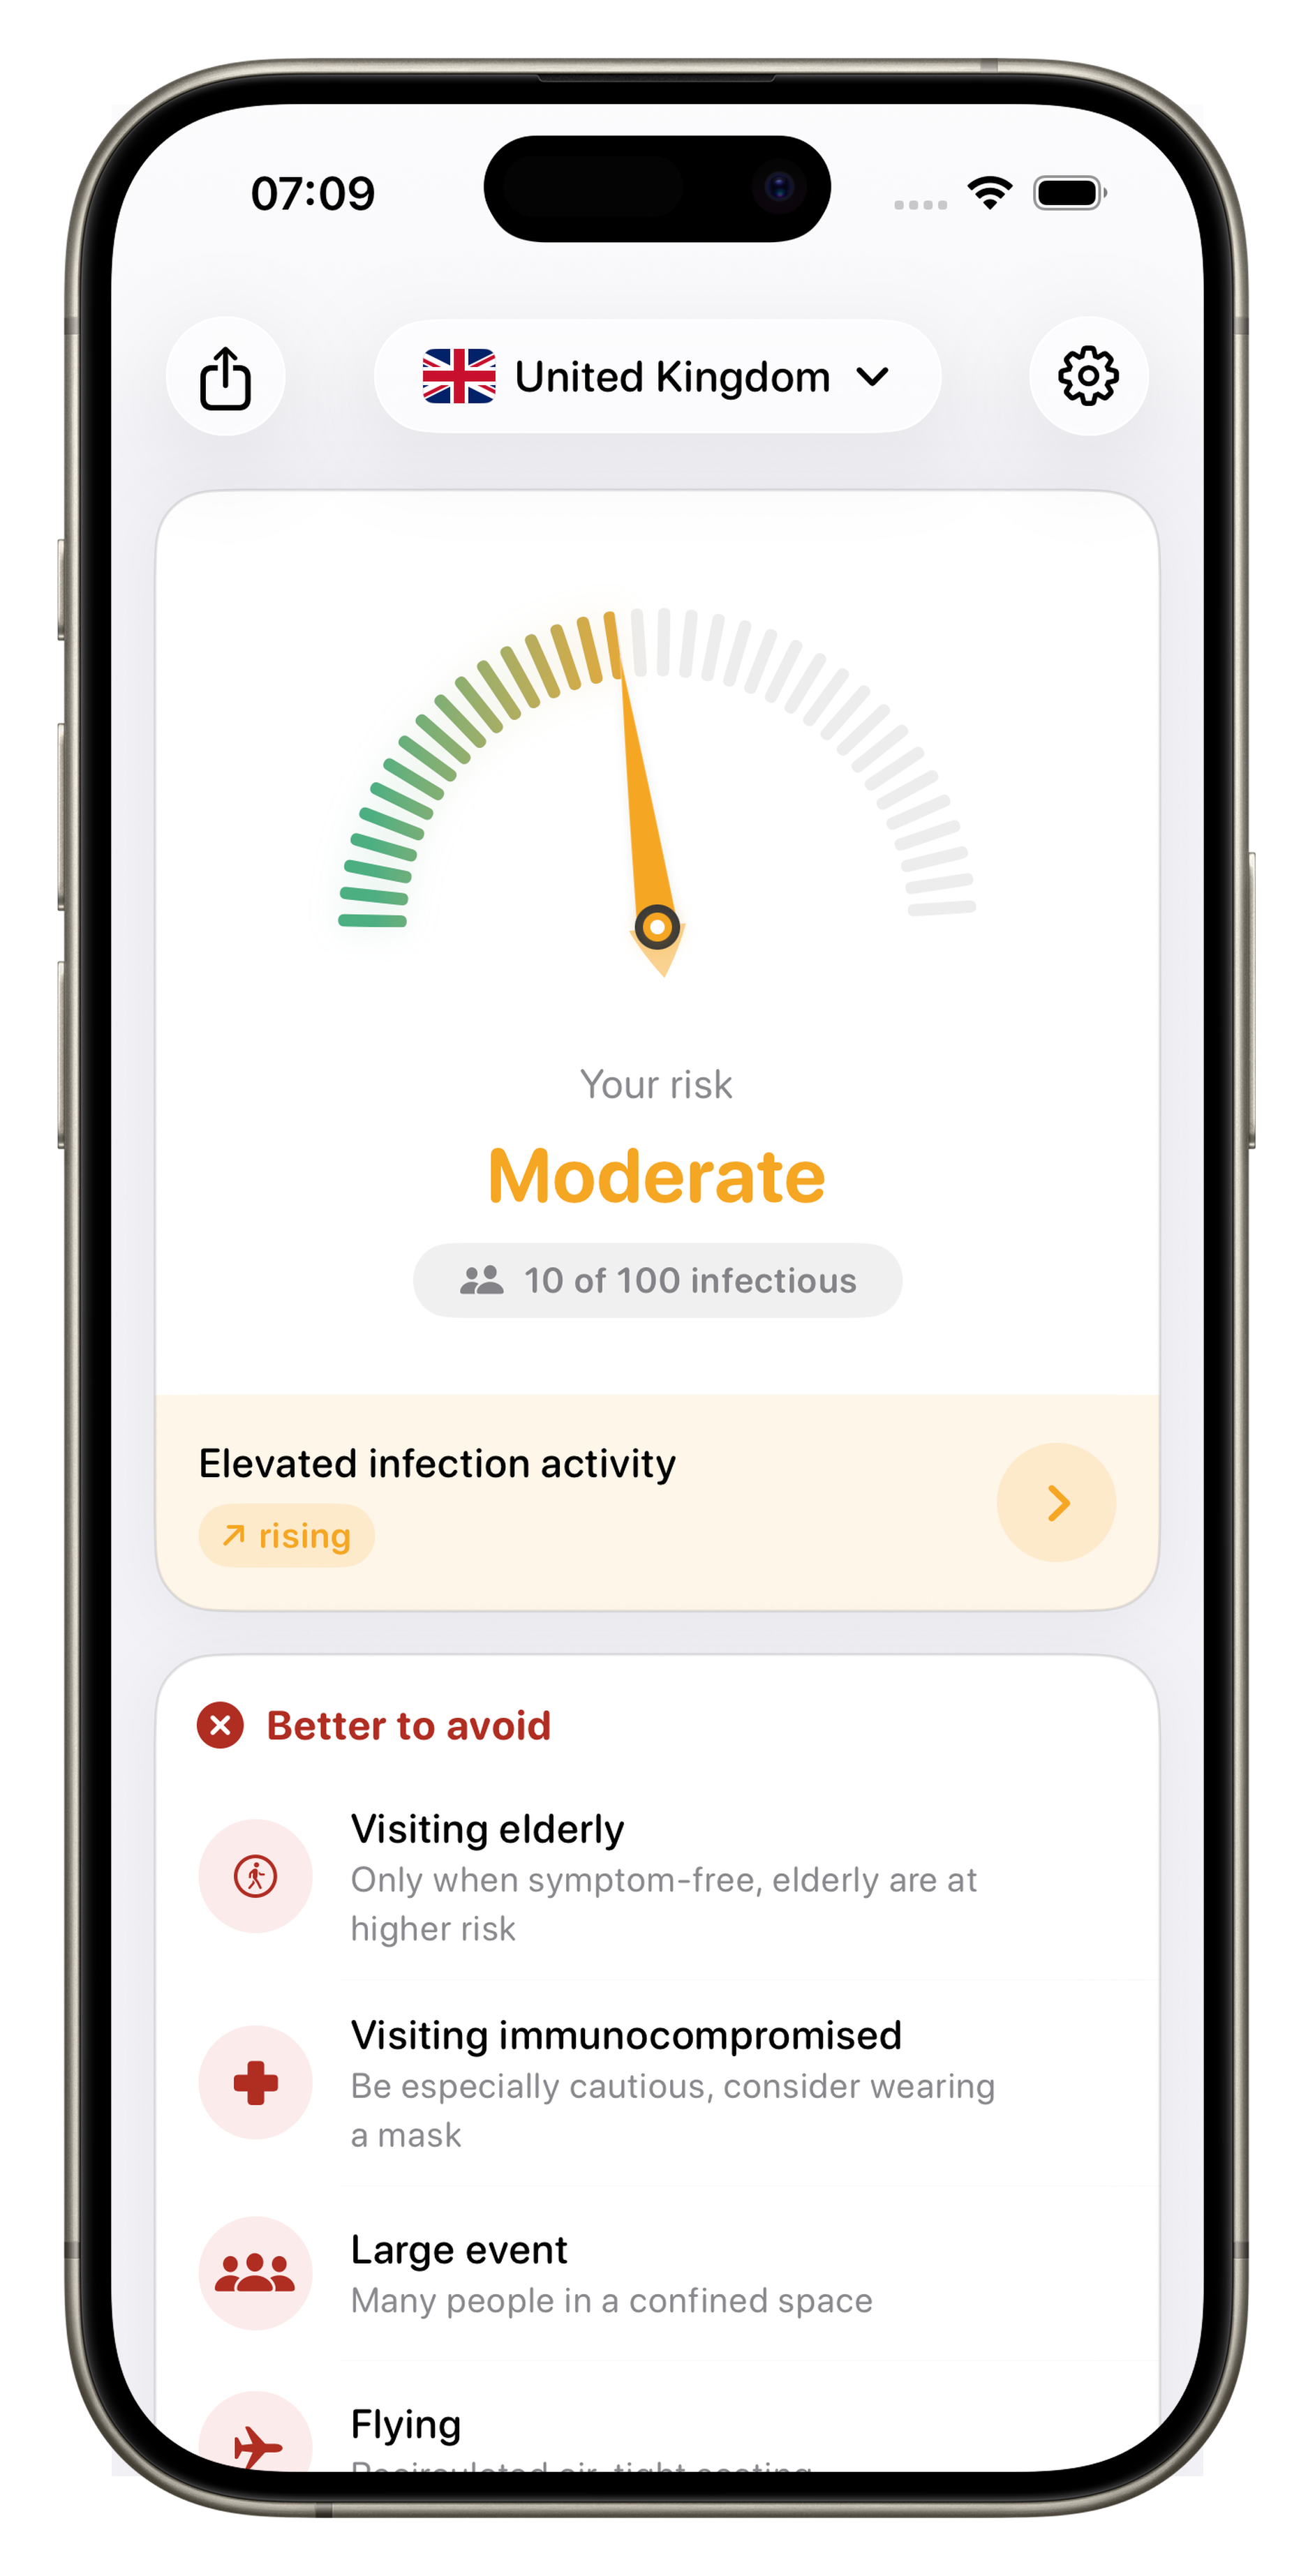
Want the actual numbers?
You'll find them in the app.
Here you only see the trend. In the app: exact incidence rates, “X out of 100 people infectious”, your personal risk based on age and pre-existing conditions, wastewater trends, 36 countries, home-screen widget.