Flu season in India
Current flu activity in India — based on WHO FluNet sentinel surveillance, set against the parallel COVID-19 and RSV trajectories.
Current situation: Influenza
In week 15 of 2026, activity of influenza (seasonal flu) in India is low. The trend — derived from clinical surveillance — is rising. A clear upward movement has emerged over the past few weeks.
The classification is based on the WHO FluNet aggregate of Indian sentinel laboratory sites (with the SENTINEL filter applied to ensure comparability of reporting). Seasonally, infection waves in India typically peak during the July to October monsoon season and again between January and March (a bimodal pattern); activity is usually markedly lower in the drier months between the two peaks. How severe a given season becomes depends on the circulating virus variant and the population's immune status, among other factors.
Data sources and methodology
The current picture for India is built on WHO FluNet, the World Health Organization's global platform for influenza surveillance. multiple national sentinel laboratories reports weekly sentinel laboratory results to FluNet, which we translate into a consultation-equivalent signal. We apply a SENTINEL-only filter because NON-SENTINEL reporting streams in India carry too much noise to be informative.
WHO FluNet
FluNet is the WHO's weekly global influenza surveillance database. National influenza centres and reference laboratories — for India this is multiple national sentinel laboratories — submit the number of respiratory specimens tested and the number positive for influenza and, where available, RSV. Using FluNet ensures a consistent, internationally comparable data source for countries without a European-style sentinel consultation system.
Positivity-based signal
Unlike ECDC ERVISS, FluNet does not carry outpatient consultation rates. Our headline signal is therefore derived from the weekly lab positivity rate (percent of tested specimens that are positive), multiplied by a pathogen-specific scaling factor — 80 for influenza and 50 for RSV — to approximate a consultation-equivalent incidence. COVID-19 is not available via FluNet and is therefore not shown for these countries.
Why this source
FluNet is the only weekly, comparable dataset covering many non-European countries. Positivity is relatively insensitive to changes in overall testing volume, which makes it a reasonable proxy for underlying transmission pressure even when the denominator fluctuates. We apply a SENTINEL-only filter where appropriate to reduce noise from non-sentinel reporting streams.
Qualitative classification
The “low”, “moderate” and “high” categories follow seasonal reference values and epidemiological thresholds calibrated to match our classifications for other countries. The positivity × scaling-factor product is mapped to the same consultation-equivalent scale we use elsewhere so results stay comparable across regions. Data refreshes weekly when WHO publishes the latest FluNet update.
Frequently asked questions
When is flu season in India?
India's influenza pattern is bimodal, unlike the single winter peak seen across most of Europe. One peak runs through the monsoon months of July–October, and a second builds during the cooler January–March window. The relative strength of the two peaks varies by year and by region, with southern states often showing stronger monsoon activity and northern states a clearer winter rise.
Who runs flu surveillance in India?
Influenza surveillance in India is carried out by a network of sentinel sites coordinated through the Indian Council of Medical Research (ICMR) and the National Centre for Disease Control (NCDC), with virological support from designated reference laboratories. Aggregated weekly data from these sentinel sites is transmitted to WHO FluNet via the South-East Asia regional reporting framework.
How does India report into WHO FluNet?
India's sentinel laboratory network submits weekly positivity and subtype-distribution data to WHO's South-East Asia Regional Office, which feeds WHO FluNet. FluNet then publishes India's curves alongside those of neighbouring South-East Asian countries. This makes India's bimodal pattern clearly visible against the single-peak patterns typical of higher-latitude countries.
Why does India have two flu peaks a year?
India's monsoon peak — roughly July through October — is driven by high humidity, crowded indoor conditions during heavy rains, and increased respiratory-virus transmission in south-west and central regions. The winter peak reflects cooler, drier northern winters with patterns closer to temperate seasonality. Together they produce a year-round baseline of flu circulation rather than a single sharp winter window.
How is flu intensity classified in Indian data?
Qualitative classification — low, moderate, high — is applied at the sentinel level, anchored to historical reference ranges for each participating site. WHO FluNet publishes the aggregated indicators. Given the bimodal pattern and significant regional variation, these qualitative tiers capture relative pressure better than absolute case counts ever could.
Want the actual numbers?
You'll find them in the app.
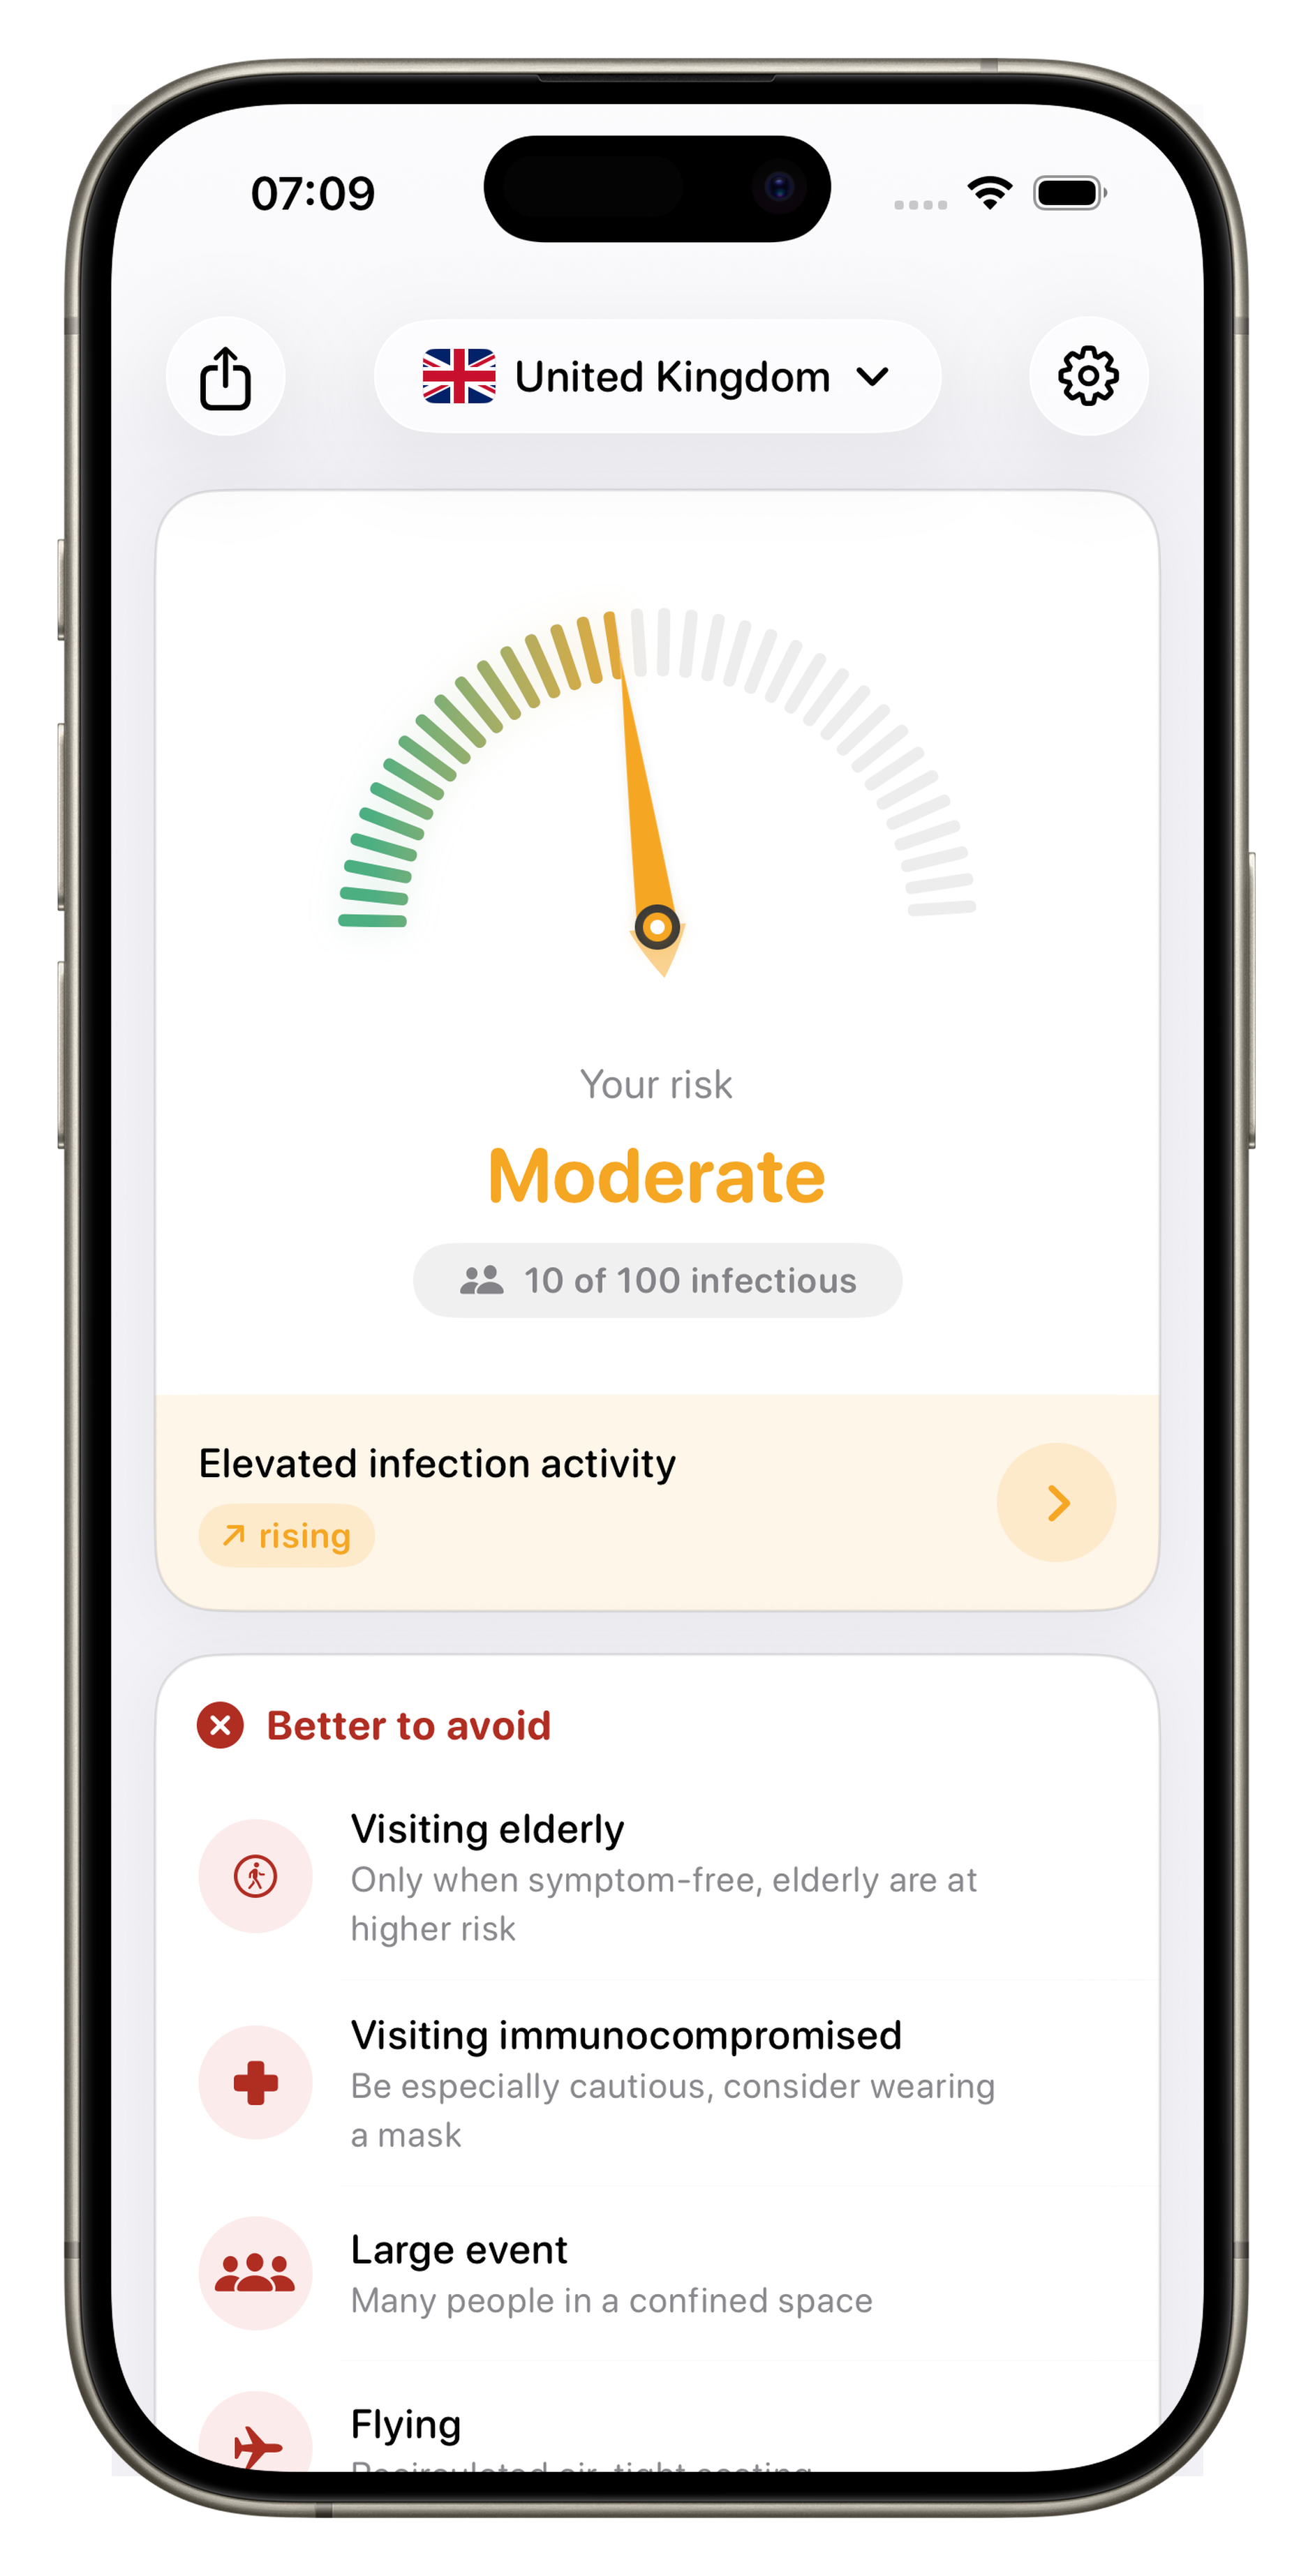
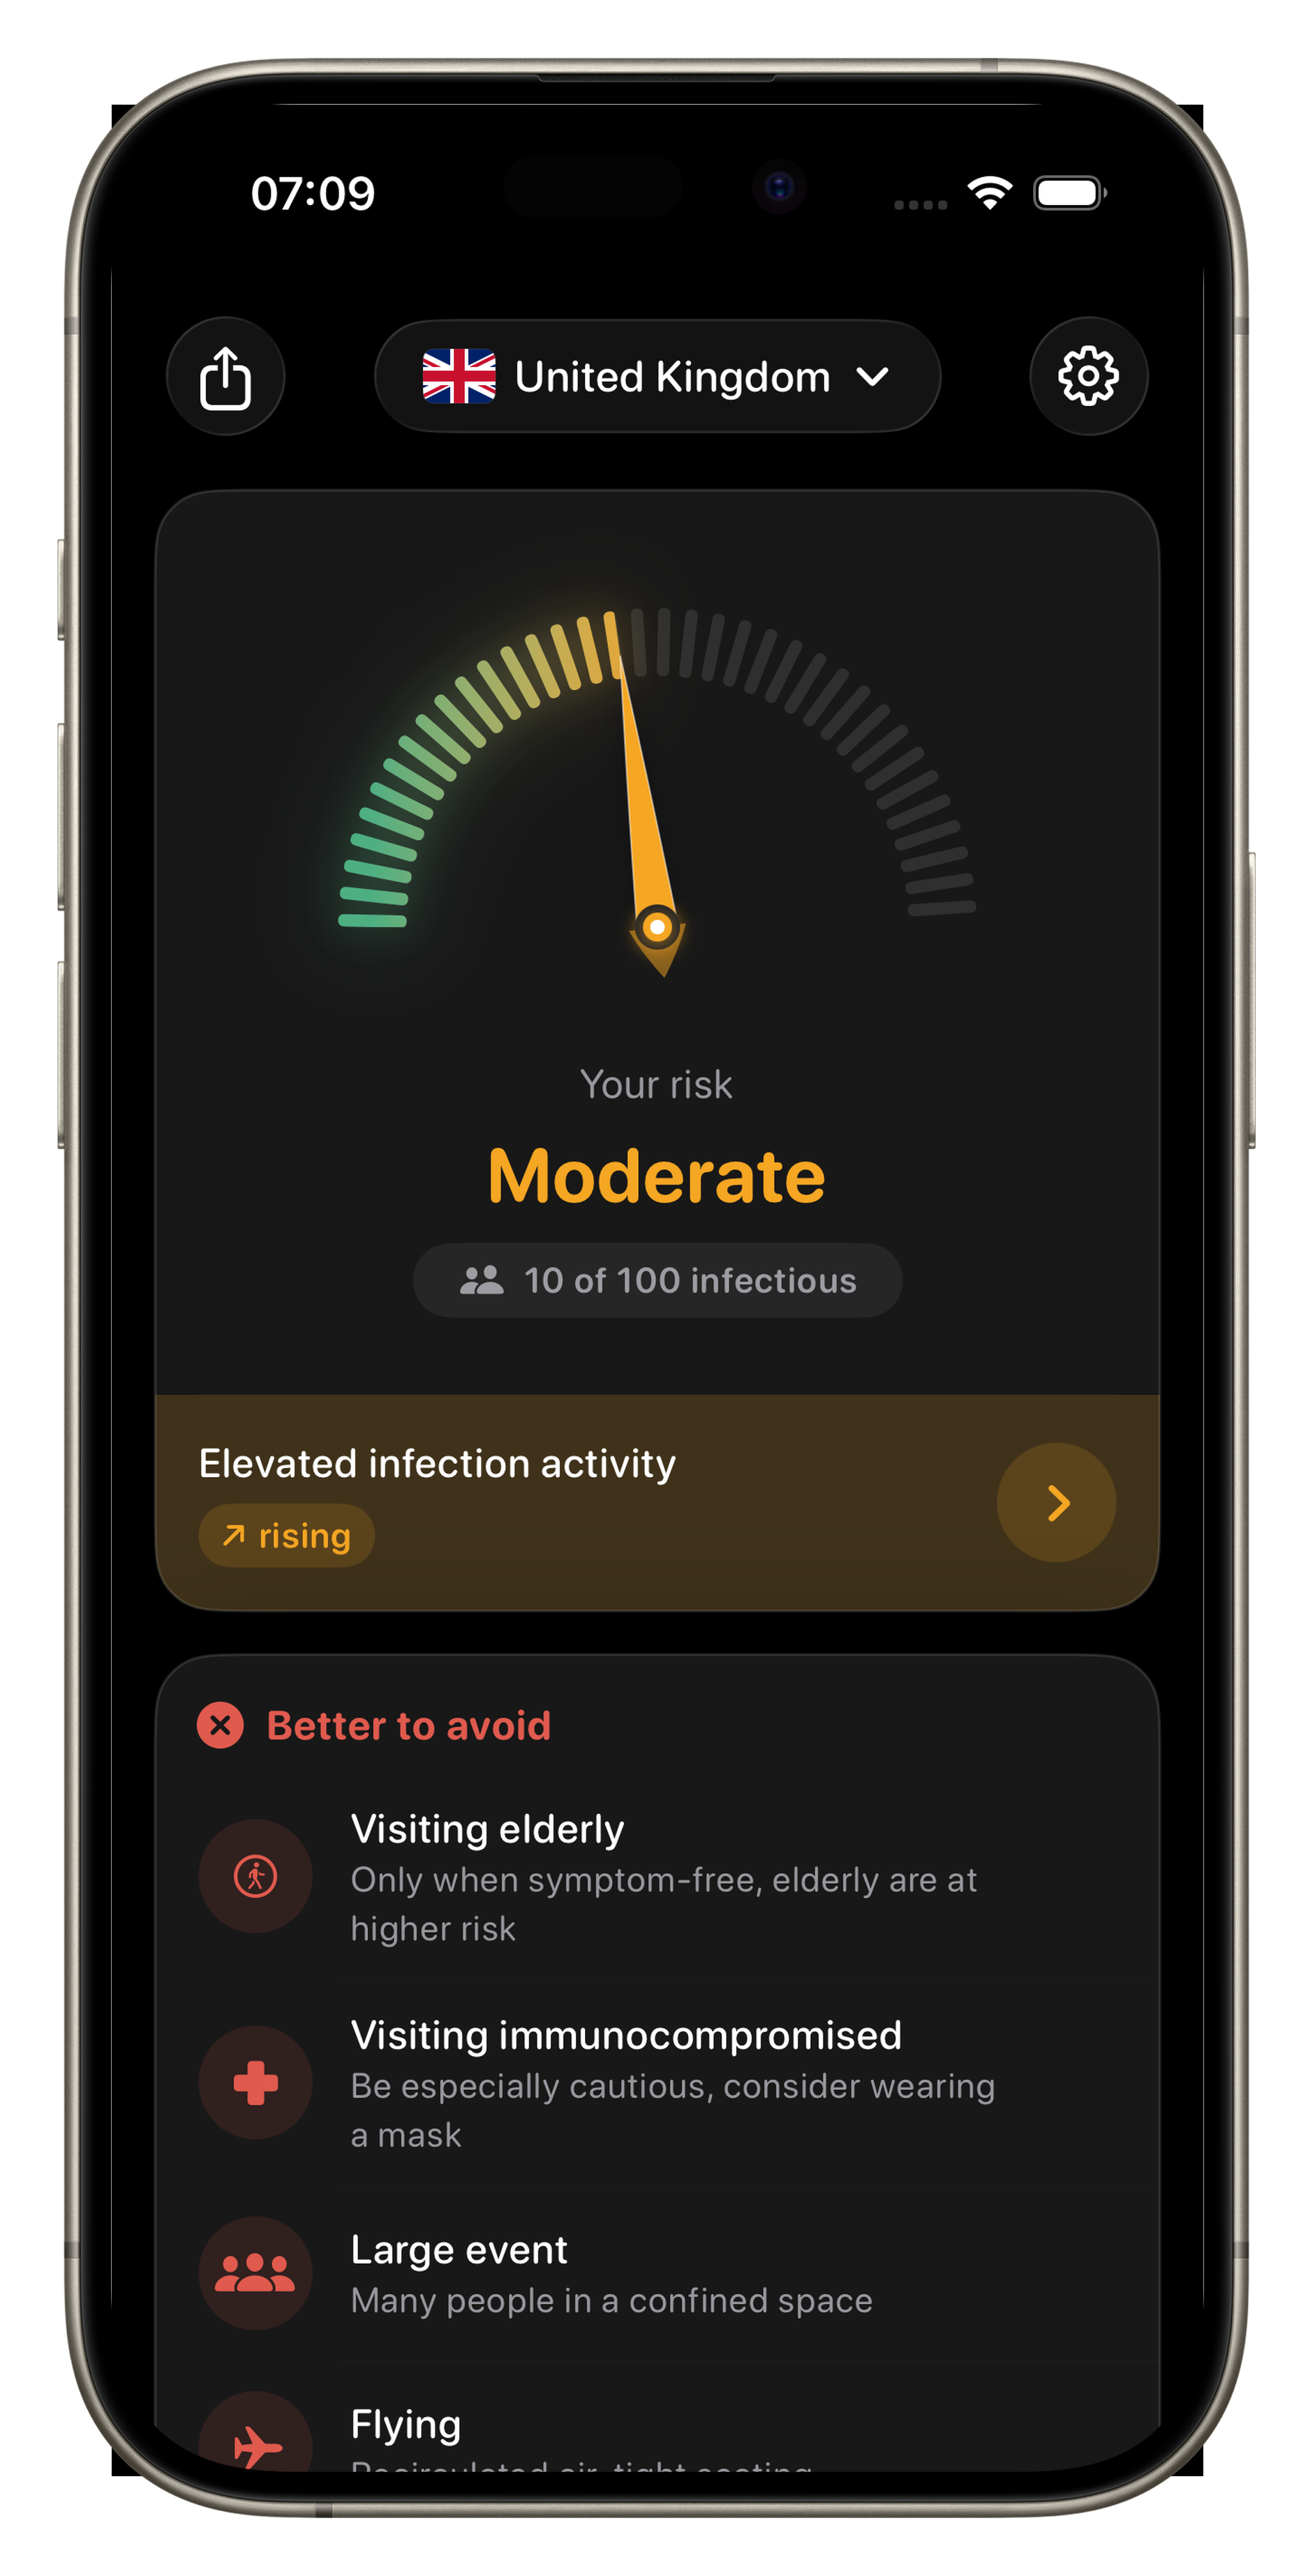
Here you only see the trend. In the app: exact incidence rates, “X out of 100 people infectious”, your personal risk based on age and pre-existing conditions, wastewater trends, 36 countries, home-screen widget.