Respiratory illness in Portugal
The three major respiratory pathogens side by side — influenza, COVID-19 and RSV — in Portugal, based on ECDC ERVISS weekly data from the Instituto Nacional de Saúde Doutor Ricardo Jorge (INSA).
Current situation: Influenza
In week 15 of 2026, activity of influenza (seasonal flu) in Portugal is low. The trend — derived from clinical surveillance — is stable.
The classification is based on the ECDC ERVISS weekly reports, drawing on data from the Instituto Nacional de Saúde Doutor Ricardo Jorge (INSA) via the Médicos-Sentinela network. Seasonally, infection waves in Portugal typically peak between December and February; activity is usually markedly lower during the summer months. How severe a given season becomes depends on the circulating virus variant and the population's immune status, among other factors.
Current situation: COVID-19
In week 15 of 2026, activity of COVID-19 in Portugal is low. The trend — derived from clinical surveillance — is stable. Over a four-week comparison, a clear decline is visible.
The classification is based on the ECDC ERVISS weekly reports, drawing on COVID-19 surveillance data from the Instituto Nacional de Saúde Doutor Ricardo Jorge (INSA) via the Médicos-Sentinela network. Seasonally, infection waves in Portugal typically peak during winter, with occasional summer waves driven by new variants; activity is usually markedly lower in late spring between waves. How severe a given season becomes depends on the circulating virus variant and the population's immune status, among other factors.
Current situation: RSV
In week 15 of 2026, activity of respiratory syncytial virus (RSV) in Portugal is low. The trend — derived from clinical surveillance — is stable.
The classification is based on the ECDC ERVISS weekly reports, drawing on RSV surveillance data from the Instituto Nacional de Saúde Doutor Ricardo Jorge (INSA) via the Médicos-Sentinela network. Seasonally, infection waves in Portugal typically peak between December and February; activity is usually markedly lower in spring and summer. How severe a given season becomes depends on the circulating virus variant and the population's immune status, among other factors.
Data sources and methodology
The current picture for Portugal is built on the European Respiratory Virus Surveillance Summary (ERVISS), published weekly by the European Centre for Disease Prevention and Control (ECDC). the Instituto Nacional de Saúde Doutor Ricardo Jorge (INSA) via the Médicos-Sentinela network is the national public-health authority that feeds ERVISS with sentinel primary care and virology data.
ECDC ERVISS
ERVISS is ECDC's weekly pan-European surveillance summary for influenza, SARS-CoV-2 and RSV. National authorities — in Portugal's case the Instituto Nacional de Saúde Doutor Ricardo Jorge (INSA) via the Médicos-Sentinela network — submit harmonised indicators every week, which ECDC publishes in a standardised dataset on Thursdays. Using ERVISS rather than each country's native portal ensures cross-country comparability.
ILI / ARI consultation rates and positivity
the Instituto Nacional de Saúde Doutor Ricardo Jorge (INSA) via the Médicos-Sentinela network operates a sentinel network of general practices that report weekly rates of patients consulting for influenza-like illness (ILI) or acute respiratory infection (ARI). A subset of patients is swabbed and tested by reference laboratories, producing pathogen-specific positivity rates for flu, SARS-CoV-2 and RSV.
Why this source
Combining consultation incidence with virological positivity yields a pathogen-specific weekly incidence signal (ILI × positivity / 100). This is the standard European methodology and provides a more robust view than either indicator alone — consultation rates capture illness burden, positivity confirms which pathogen is driving it.
Qualitative classification
The “low”, “moderate” and “high” categories follow seasonal reference values and epidemiological thresholds calibrated to match our classifications for other countries. The ILI × positivity / 100 product is scaled to comparable thresholds using a divisor of 3, which aligns European sentinel peaks with the consultation-equivalent scale used elsewhere. Data refreshes weekly when ECDC publishes the latest ERVISS update, typically on Thursdays.
Frequently asked questions
How is overall respiratory-illness activity tracked in Portugal?
INSA combines sentinel GP consultations via Médicos Sentinela, sentinel-laboratory positivity, hospital and ICU admissions, wastewater detection of SARS-CoV-2, and variant characterisation by the National Reference Laboratory into a weekly respiratory-virus picture covering flu, SARS-CoV-2, and RSV. The same indicators feed ECDC ERVISS. On infectrisk.com we condense this picture into a qualitative low/moderate/high classification.
Did Portugal experience a “tripledemic”?
“Tripledemic” is a media term for the simultaneous winter circulation of flu, COVID-19, and RSV first widely discussed during the 2022–2023 season. Portugal saw clear co-circulation of all three pathogens that winter, with notable pressure on paediatric wards from RSV and on adult critical care from flu and COVID-19. Co-circulation has recurred each winter since, though the relative intensity of each pathogen varies.
Why do respiratory illnesses peak in a Portuguese winter?
The drivers are consistent across temperate Atlantic Europe, even in Portugal's milder climate. Many respiratory viruses remain stable longer in cool indoor air, and heated indoor environments reduce humidity in ways that weaken airway defence. People mix indoors more during Portuguese winters, schools amplify transmission among children, and end-of-year gatherings accelerate spread. Immunity to seasonal strains is also typically at its lowest as exposure rises.
How does INSA decide that activity is “high”?
INSA uses thresholds derived from historical reference data. Current indicators — sentinel consultations, laboratory positivity, hospitalisations, wastewater signals — are compared against baselines from past non-epidemic weeks and against reference points from severe past seasons. When several indicators cross into elevated ranges at the same time, the weekly bulletin flags activity as high. Portugal's ERVISS contribution uses the same framework for cross-country comparison.
How does Portugal compare to Spain and other EU countries?
Portugal's winter respiratory burden often tracks closely with Spain, reflecting similar climate, travel patterns, and demographic structure across the Iberian Peninsula. Because both report into ECDC ERVISS on the same schedule and methodology, the relative timing and intensity of their peaks is easy to read in the European dashboards. Lead–lag patterns between Portugal and its neighbours are usually small, driven more by school terms and travel than by climate.
Want the actual numbers?
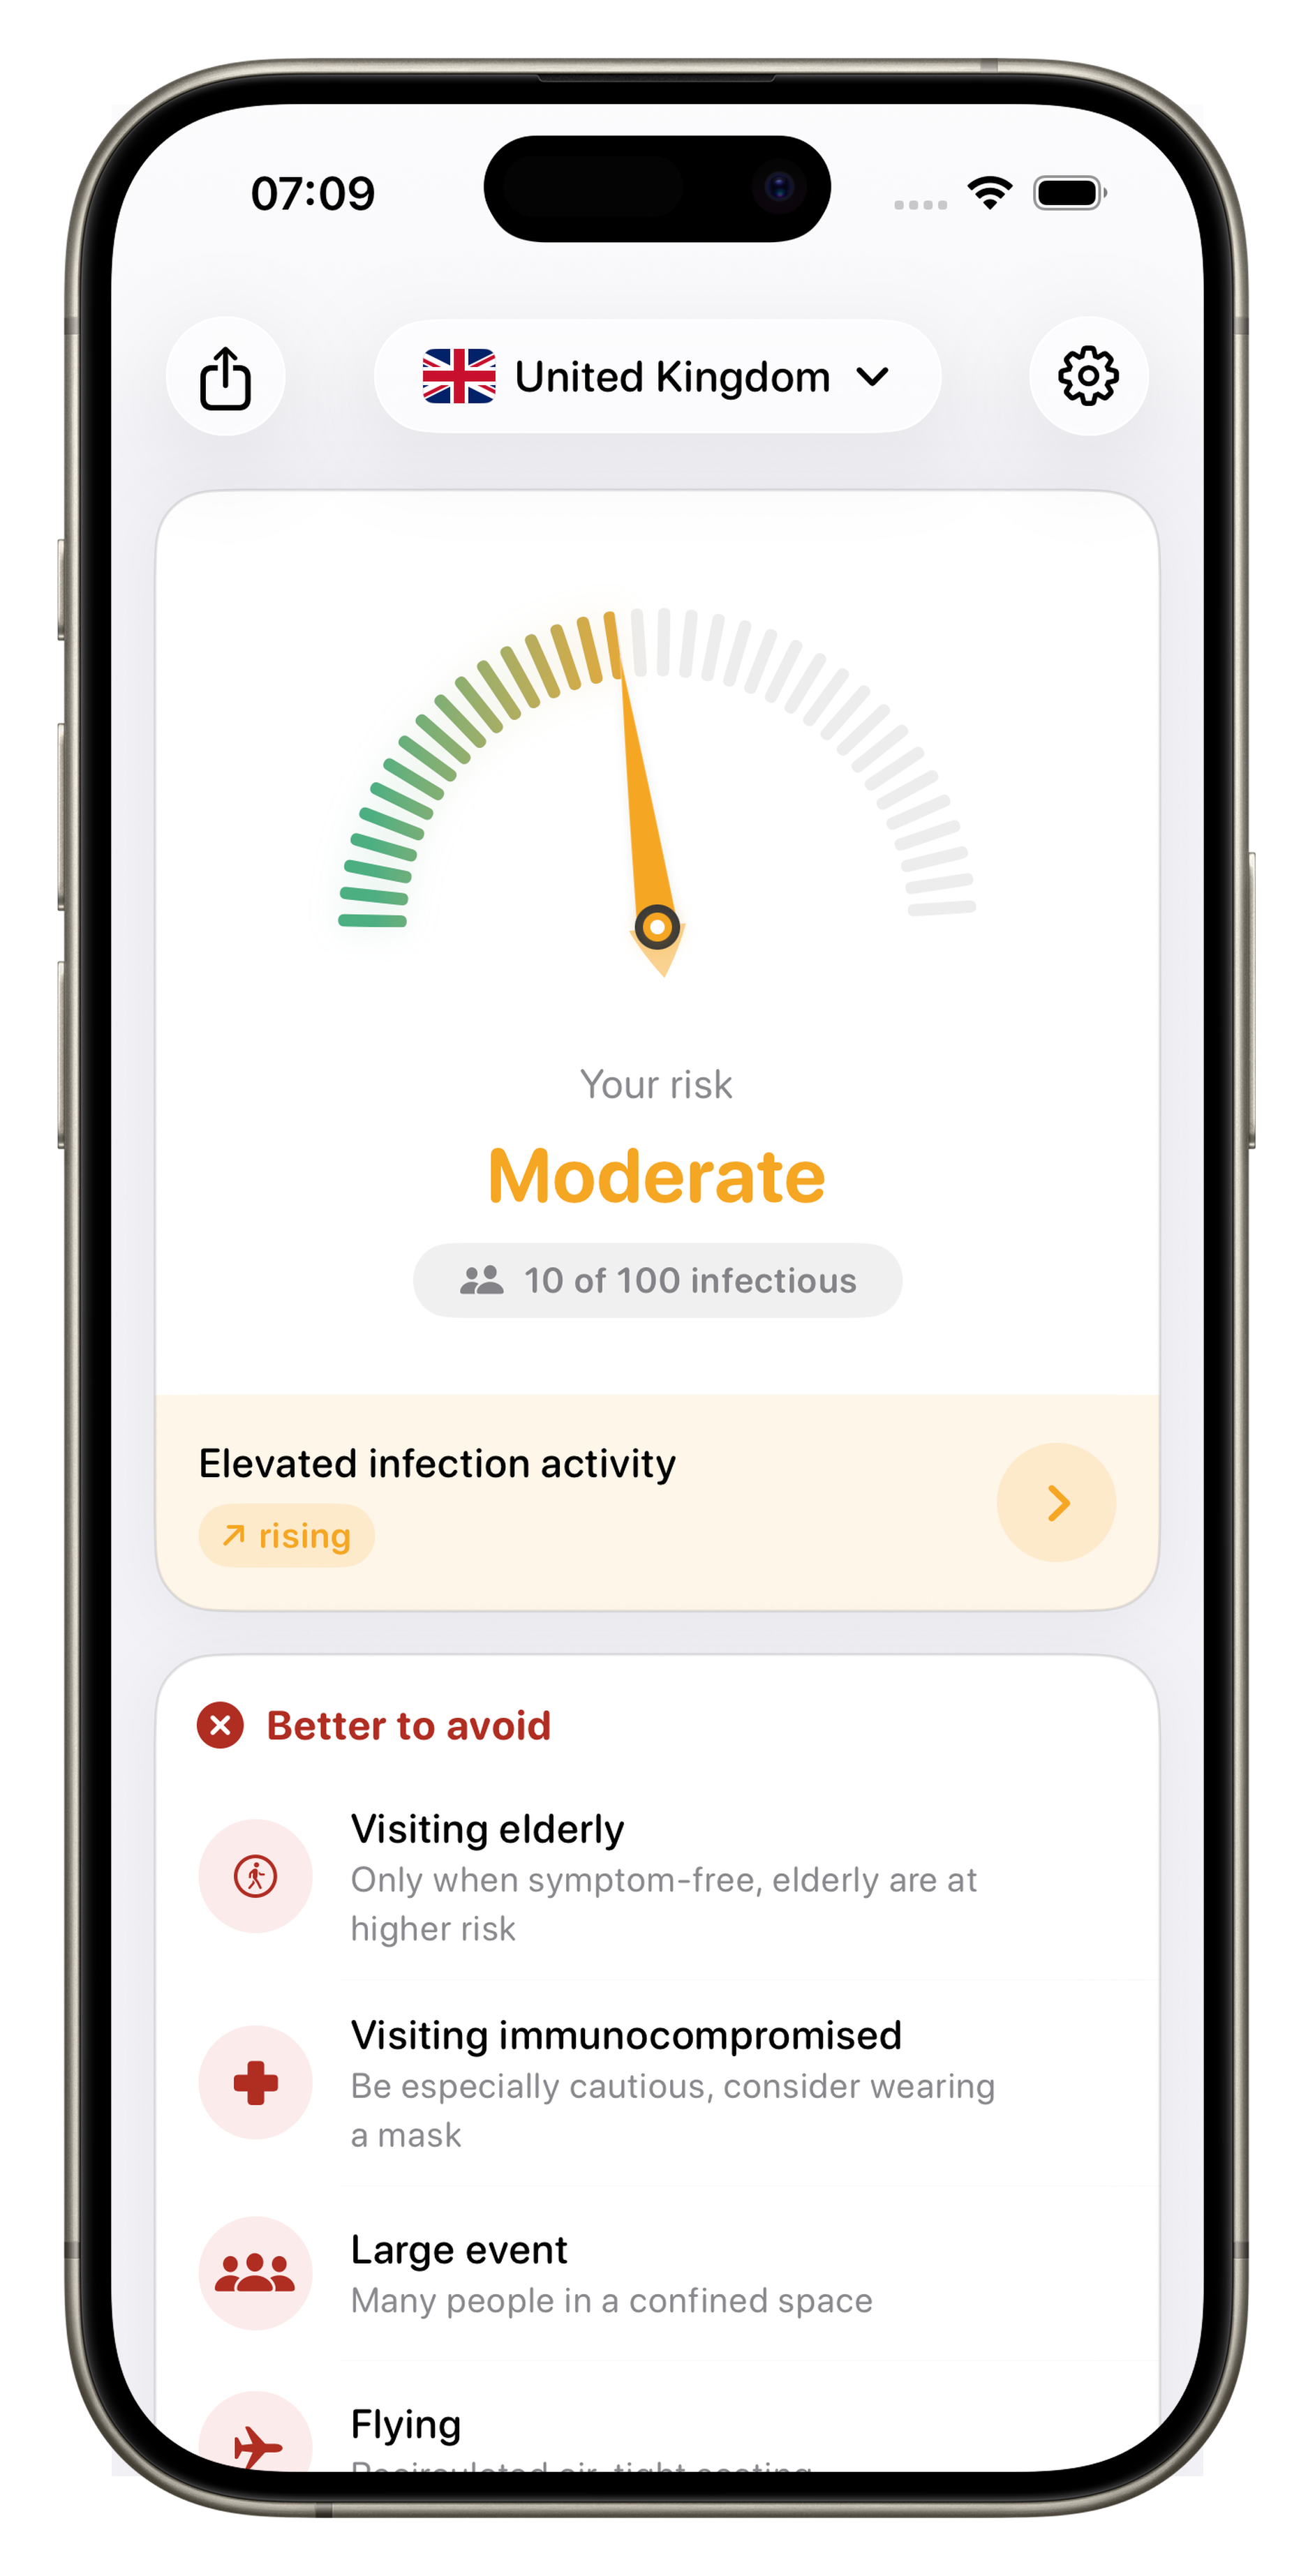
You'll find them in the app.
Here you only see the trend. In the app: exact incidence rates, “X out of 100 people infectious”, your personal risk based on age and pre-existing conditions, wastewater trends, 36 countries, home-screen widget.