Flu season in the United Kingdom
Current flu, COVID-19 and RSV activity in the UK — based on the UKHSA Respiratory Surveillance Dashboard. Hospital admission rates rescaled into a consultation-equivalent signal for a qualitative low / moderate / high classification.
Current situation: Influenza
In week 15 of 2026, activity of influenza (seasonal flu) in the United Kingdom is low. The trend — derived from weekly hospital admission rates — is rising. Activity has barely shifted over the past few weeks.
The classification is based on the UKHSA Respiratory Surveillance Dashboard, combining hospital admission rates with the RCGP sentinel surveillance network run with the Royal College of General Practitioners. Seasonally, infection waves in the United Kingdom typically peak between December and February; activity is usually markedly lower during the summer months. How severe a given season becomes depends on the circulating virus variant and the population's immune status, among other factors.
Data sources and methodology
The current picture for the United Kingdom is built on the UK Health Security Agency (UKHSA) Dashboard. UKHSA is the national public-health authority for England and publishes weekly NHS England hospital admission rates for influenza and RSV, alongside daily case rate data for COVID-19. We rescale these signals into a consultation-equivalent indicator so the qualitative “low / moderate / high” categories are consistent with how we report other countries.
UKHSA Dashboard
The UKHSA Dashboard is the official public data portal of the UK Health Security Agency. It aggregates surveillance data from NHS England, sentinel primary care networks and laboratory reporting. For our headline level we use the weekly hospital admission rates for flu and RSV, and the daily COVID-19 case rate series.
Hospital admission rates
Flu and RSV are reported as laboratory-confirmed hospital admissions per 100,000 population per week, submitted by NHS England trusts. For COVID-19 the UKHSA Dashboard exposes a daily case rate series, which we aggregate into a weekly rolling mean. Together these give a stable signal of severe respiratory illness pressure that is robust to changes in individual testing behaviour.
Why this source
UKHSA is the authoritative source for England-wide respiratory surveillance and the only one to publish hospital admission rates with national coverage on a weekly cadence. Hospital admissions reflect the load on the healthcare system and update with roughly a one-week lag, while the COVID case-rate series tracks transmission more directly.
Qualitative classification
The “low”, “moderate” and “high” categories follow seasonal reference values and epidemiological thresholds calibrated to match our classifications for other countries. Admission rates and the COVID case-rate series are scaled to consultation-equivalent incidence using pathogen-specific conversion factors derived from typical seasonal peaks. Data refreshes weekly when UKHSA publishes the latest Dashboard update.
Frequently asked questions
When is flu season in the UK?
In the UK, flu activity typically begins rising in late autumn, climbs through December, and peaks between December and February before tailing off in March or April. The precise timing shifts year to year with the circulating influenza subtypes and population immunity. The UK Health Security Agency (UKHSA) tracks the curve each week and signals when activity enters elevated ranges, though intensity and duration vary considerably between seasons.
How does the UK classify the severity of a flu season?
UKHSA publishes a weekly national influenza and COVID-19 surveillance report and runs the UKHSA Dashboard, which together describe activity in qualitative bands from baseline to very high. Indicators include GP in-hours consultations via the Royal College of General Practitioners (RCGP) sentinel network, hospital admissions, ICU admissions, and laboratory-confirmed positivity. A season is considered severe once several indicators cross defined thresholds at the same time.
How is flu surveillance actually done in the UK?
UKHSA combines several data streams. Sentinel GP practices in the RCGP network record respiratory consultations and submit swabs for virological testing. Hospital surveillance through the Severe Acute Respiratory Infection (SARI-Watch) system captures admissions and critical care. The DataMart system provides laboratory-confirmed case numbers from NHS trusts. These feeds update weekly and are published on the UKHSA Dashboard alongside other respiratory pathogens.
Should I get the NHS flu vaccine?
The NHS offers a free annual flu vaccine to eligible groups including adults aged 65 and over, pregnant women, people with certain long-term health conditions, carers, frontline health and social care workers, and children from age two upwards. Uptake data is published by UKHSA each season. Vaccination remains the most effective single measure for reducing the risk of severe flu and the indirect burden on NHS winter capacity.
How does this year's UK flu season compare to previous ones?
Each season is shaped by the dominant subtype (influenza A(H3N2), A(H1N1)pdm09, or B) and by residual immunity from recent years. UKHSA reports plot current activity against historic thresholds, so it is possible to see whether the curve is running above or below the recent five-year average. Some seasons begin early and peak quickly; others are prolonged and moderate. No two winters produce the same pattern.
Want the actual numbers?
You'll find them in the app.
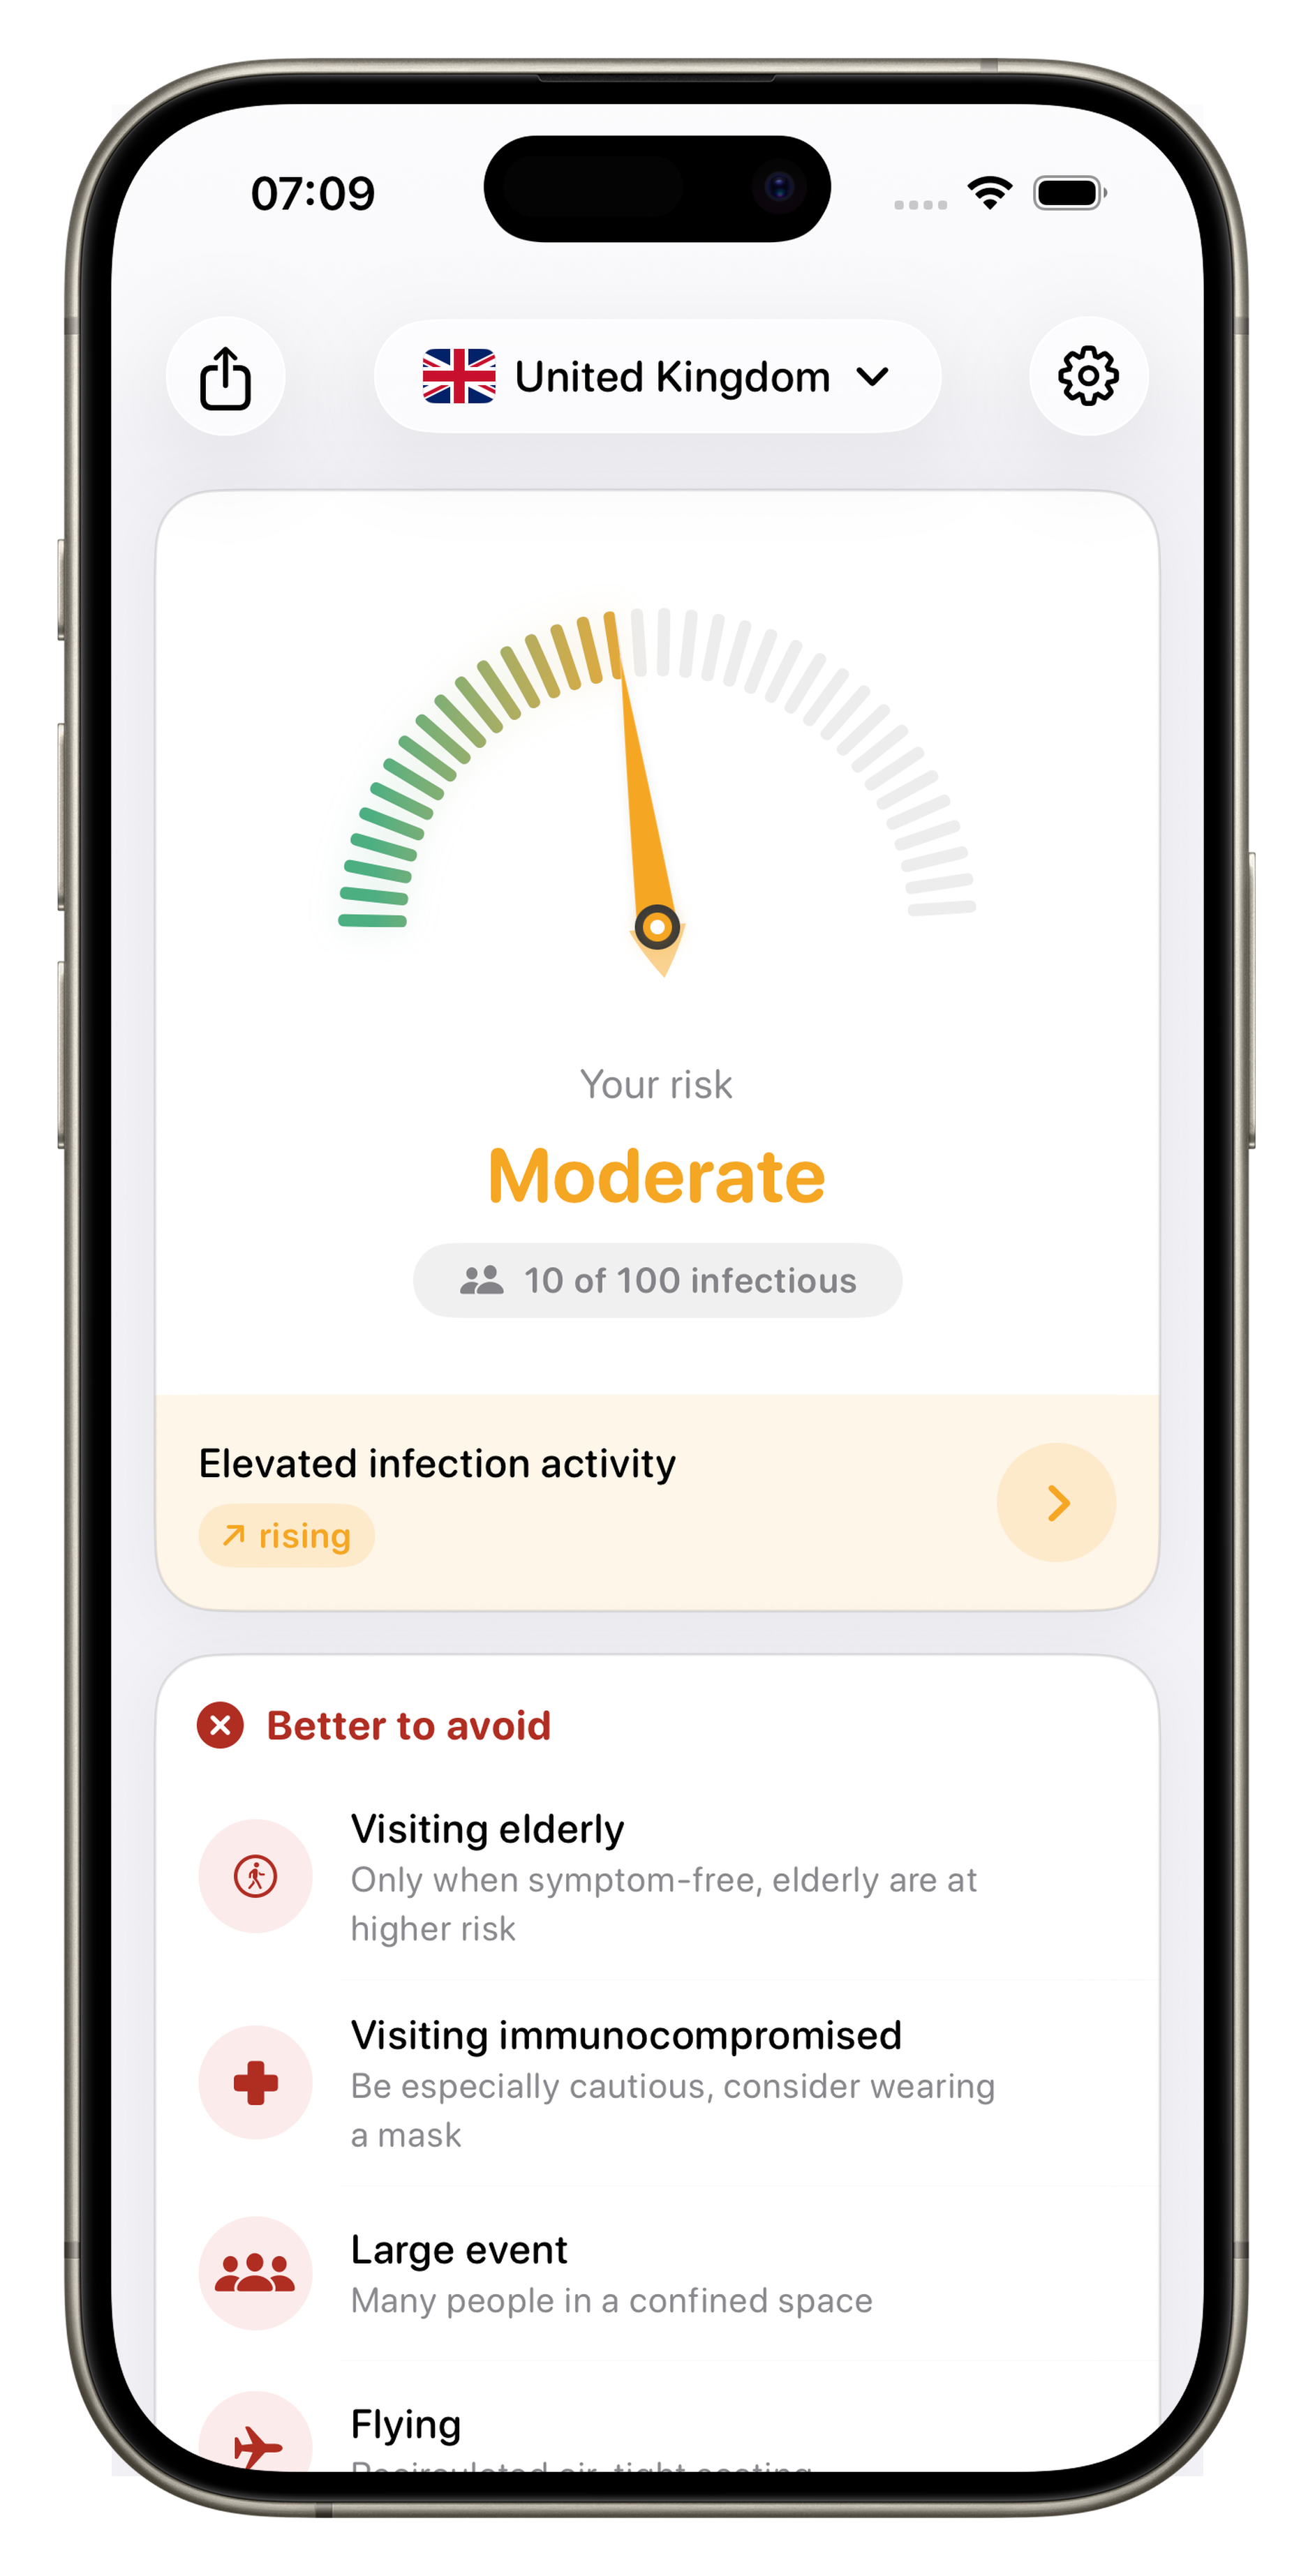
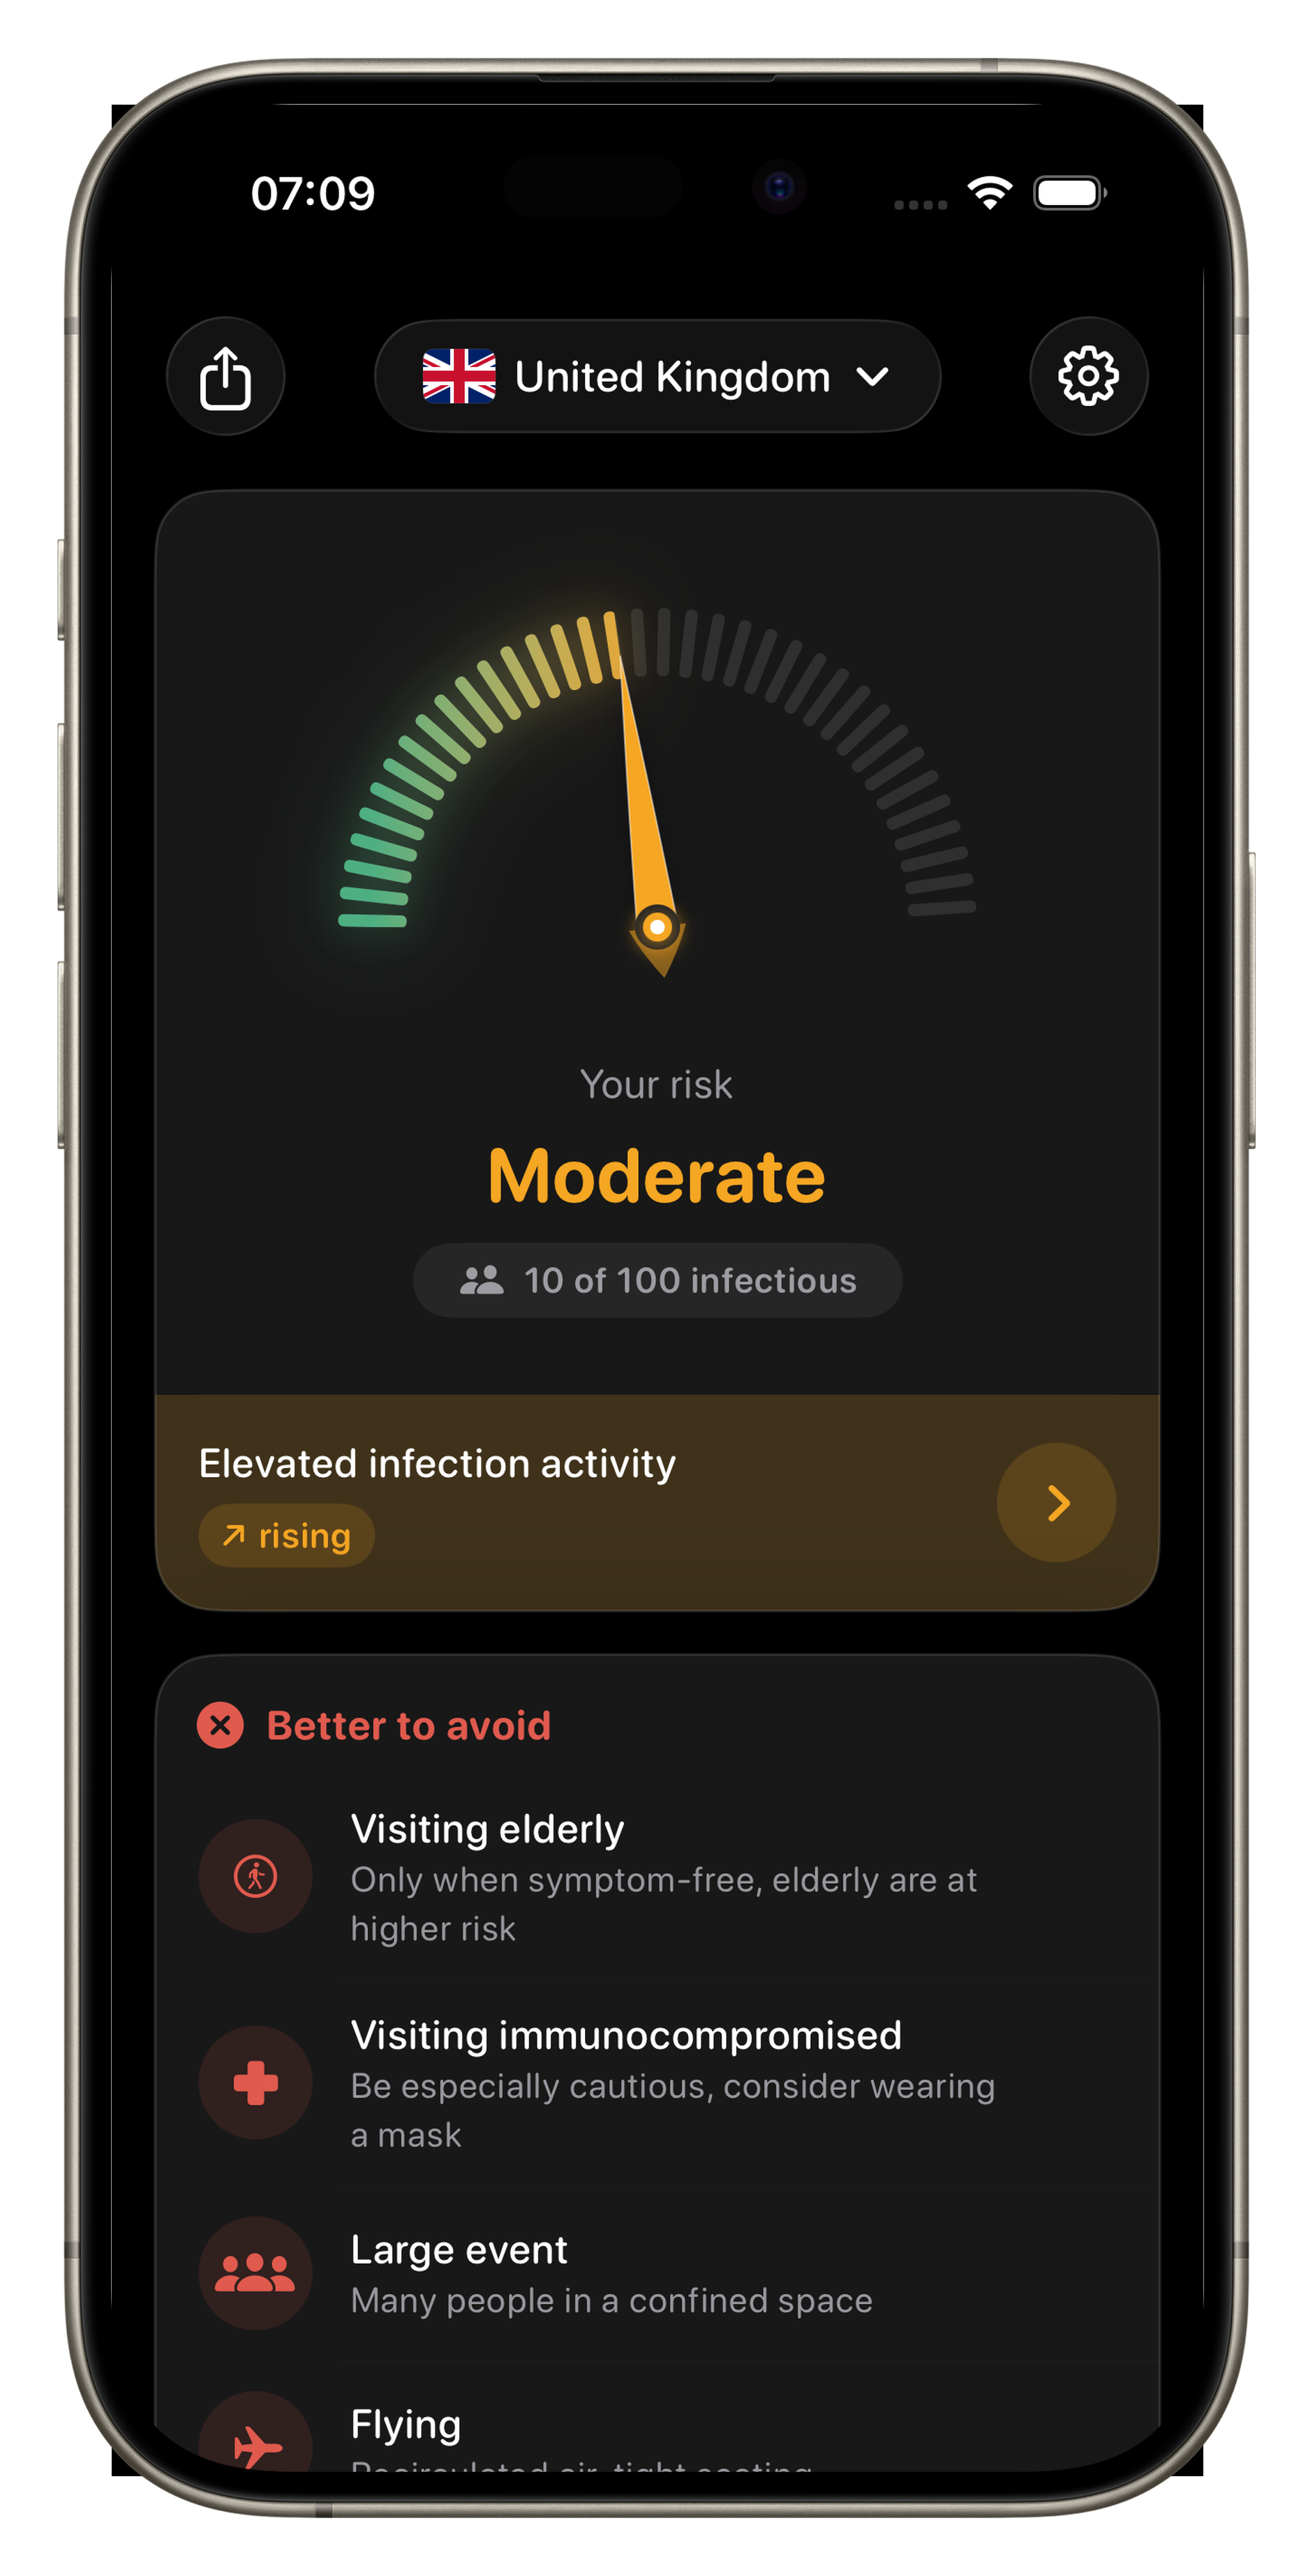
Here you only see the trend. In the app: exact incidence rates, “X out of 100 people infectious”, your personal risk based on age and pre-existing conditions, wastewater trends, 36 countries, home-screen widget.